Sallie Mae 2012 Annual Report Download - page 31
Download and view the complete annual report
Please find page 31 of the 2012 Sallie Mae annual report below. You can navigate through the pages in the report by either clicking on the pages listed below, or by using the keyword search tool below to find specific information within the annual report.-
 1
1 -
2
-
3
-
4
-
5
-
6
-
7
-
8
-
9
-
10
-
11
-
12
-
13
-
14
-
15
-
16
-
17
-
18
-
19
-
20
-
 21
21 -
 22
22 -
 23
23 -
 24
24 -
 25
25 -
 26
26 -
 27
27 -
 28
28 -
 29
29 -
 30
30 -
 31
31 -
 32
32 -
 33
33 -
 34
34 -
 35
35 -
 36
36 -
 37
37 -
 38
38 -
 39
39 -
 40
40 -
 41
41 -
42
-
43
-
44
-
45
-
46
-
47
-
48
-
49
-
50
-
51
-
52
-
53
-
54
-
55
-
56
-
57
-
58
-
59
-
60
-
61
-
62
-
63
-
64
-
65
-
66
-
67
-
68
-
69
-
70
-
71
-
72
-
73
-
74
-
75
-
76
-
77
-
78
-
79
-
80
-
81
-
82
-
83
-
84
-
85
-
86
-
87
-
88
-
89
-
90
-
91
-
92
-
93
-
94
-
95
-
96
-
97
-
98
-
99
-
100
-
101
-
102
-
103
-
104
-
105
-
106
-
107
-
108
-
109
-
110
-
111
-
112
-
113
-
114
-
115
-
116
-
117
-
118
-
119
-
120
-
121
-
122
-
123
-
124
-
125
-
126
-
127
-
128
-
129
-
130
-
131
-
132
-
133
-
134
-
135
-
136
-
137
-
138
-
139
-
140
-
141
-
142
-
143
-
144
-
145
-
146
-
147
-
148
-
149
-
150
-
151
-
152
-
153
-
154
-
155
-
156
-
157
-
158
-
159
-
160
-
161
-
162
-
163
-
164
-
165
-
166
-
167
-
168
-
169
-
170
-
171
-
172
-
173
-
174
-
175
-
176
-
177
-
178
-
179
-
180
-
181
-
182
-
183
-
184
-
185
-
186
-
187
-
188
-
189
-
190
-
191
-
192
-
193
-
194
-
195
-
196
-
197
-
198
-
199
-
200
-
201
-
202
-
203
-
204
-
205
-
206
-
207
 |
 |

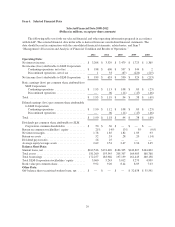
Item 6. Selected Financial Data
Selected Financial Data 2008-2012
(Dollars in millions, except per share amounts)
The following table sets forth our selected financial and other operating information prepared in accordance
with GAAP. The selected financial data in the table is derived from our consolidated financial statements. The
data should be read in conjunction with the consolidated financial statements, related notes, and Item 7
“Management’s Discussion and Analysis of Financial Condition and Results of Operations.”
2012 2011 2010 2009 2008
Operating Data:
Net interest income ............................ $ 3,208 $ 3,529 $ 3,479 $ 1,723 $ 1,365
Net income (loss) attributable to SLM Corporation:
Continuing operations, net of tax ............. $ 938 $ 600 $ 597 $ 544 $ 2
Discontinued operations, net of tax ........... 1 33 (67) (220) (215)
Net income (loss) attributable to SLM Corporation . . $ 939 $ 633 $ 530 $ 324 $ (213)
Basic earnings (loss) per common share attributable to
SLM Corporation:
Continuing operations ..................... $ 1.93 $ 1.13 $ 1.08 $ .85 $ (.23)
Discontinued operations .................... — .06 (.14) (.47) (.46)
Total ....................................... $ 1.93 $ 1.19 $ .94 $ .38 $ (.69)
Diluted earnings (loss) per common share attributable
to SLM Corporation:
Continuing operations ..................... $ 1.90 $ 1.12 $ 1.08 $ .85 $ (.23)
Discontinued operations .................... — .06 (.14) (.47) (.46)
Total ....................................... $ 1.90 $ 1.18 $ .94 $ .38 $ (.69)
Dividends per common share attributable to SLM
Corporation common shareholders ............. $ .50 $ .30 $ — $ — $ —
Return on common stockholders’ equity ........... 21% 14% 13% 5% (9)%
Net interest margin ............................ 1.78 1.85 1.82 1.05 .93
Return on assets .............................. .52 .33 .28 .20 (.14)
Dividend payout ratio .......................... 26 25 — — —
Average equity/average assets ................... 2.69 2.54 2.47 2.96 3.45
Balance Sheet Data:
Student loans, net ............................. $162,546 $174,420 $184,305 $143,807 $144,802
Total assets .................................. 181,260 193,345 205,307 169,985 168,768
Total borrowings ............................. 172,257 183,966 197,159 161,443 160,158
Total SLM Corporation stockholders’ equity ....... 5,060 5,243 5,012 5,279 4,999
Book value per common share ................... 9.92 9.20 8.44 8.05 7.03
Other Data:
Off-balance sheet securitized student loans, net ..... $ — $ — $ — $ 32,638 $ 35,591
29