Sallie Mae 2012 Annual Report Download - page 52
Download and view the complete annual report
Please find page 52 of the 2012 Sallie Mae annual report below. You can navigate through the pages in the report by either clicking on the pages listed below, or by using the keyword search tool below to find specific information within the annual report.-
 1
1 -
2
-
3
-
4
-
5
-
6
-
7
-
8
-
9
-
10
-
11
-
12
-
13
-
14
-
15
-
16
-
17
-
18
-
19
-
20
-
21
-
22
-
23
-
24
-
25
-
26
-
27
-
28
-
29
-
30
-
31
-
32
-
33
-
34
-
35
-
36
-
37
-
38
-
39
-
40
-
41
-
 42
42 -
 43
43 -
 44
44 -
 45
45 -
 46
46 -
 47
47 -
 48
48 -
 49
49 -
 50
50 -
 51
51 -
 52
52 -
 53
53 -
 54
54 -
 55
55 -
 56
56 -
 57
57 -
 58
58 -
 59
59 -
 60
60 -
 61
61 -
 62
62 -
63
-
64
-
65
-
66
-
67
-
68
-
69
-
70
-
71
-
72
-
73
-
74
-
75
-
76
-
77
-
78
-
79
-
80
-
81
-
82
-
83
-
84
-
85
-
86
-
87
-
88
-
89
-
90
-
91
-
92
-
93
-
94
-
95
-
96
-
97
-
98
-
99
-
100
-
101
-
102
-
103
-
104
-
105
-
106
-
107
-
108
-
109
-
110
-
111
-
112
-
113
-
114
-
115
-
116
-
117
-
118
-
119
-
120
-
121
-
122
-
123
-
124
-
125
-
126
-
127
-
128
-
129
-
130
-
131
-
132
-
133
-
134
-
135
-
136
-
137
-
138
-
139
-
140
-
141
-
142
-
143
-
144
-
145
-
146
-
147
-
148
-
149
-
150
-
151
-
152
-
153
-
154
-
155
-
156
-
157
-
158
-
159
-
160
-
161
-
162
-
163
-
164
-
165
-
166
-
167
-
168
-
169
-
170
-
171
-
172
-
173
-
174
-
175
-
176
-
177
-
178
-
179
-
180
-
181
-
182
-
183
-
184
-
185
-
186
-
187
-
188
-
189
-
190
-
191
-
192
-
193
-
194
-
195
-
196
-
197
-
198
-
199
-
200
-
201
-
202
-
203
-
204
-
205
-
206
-
207
 |
 |
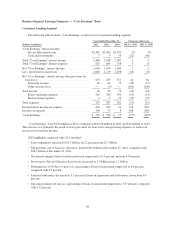
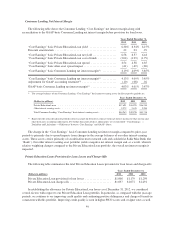
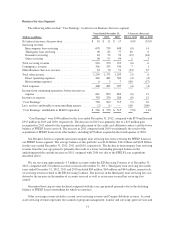
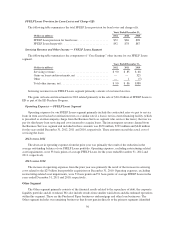
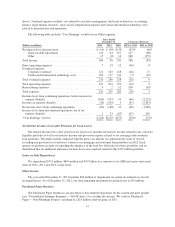
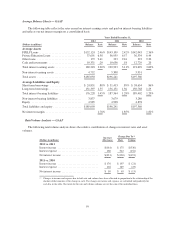
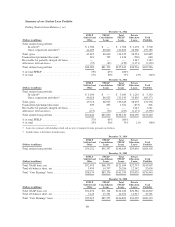
as a more seasoned portfolio. Total loans delinquent (as a percentage of loans in repayment) has decreased to 9.3
percent from 10.1 percent in the year-ago period. Loans greater than 90 days delinquent (as a percentage of loans
in repayment) has decreased to 4.6 percent from 4.9 percent in the year-ago period. Loans in forbearance (as a
percentage of loans in repayment and forbearance) decreased to 3.5 percent from 4.4 percent in the year-ago
period. The charge-off rate declined from 3.7 percent in 2011 to 3.4 percent in 2012.
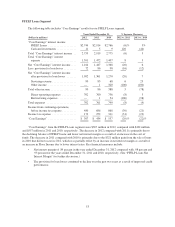
Apart from these overall improvements, Private Education Loans that have defaulted between 2008 and
2011 for which we have previously charged off estimated losses have, to varying degrees, not met our post-
default recovery expectations to date and may continue not to do so. Our allowance for loan losses takes into
account these potential recovery uncertainties.
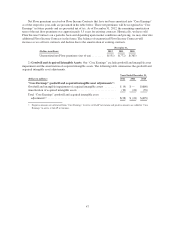
The $171 million decline in the Private Education Loan provision for loan losses for the year ended
December 31, 2012 compared with the prior year reflects the improving credit quality and performance trends
discussed above.
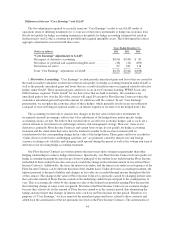
For a more detailed discussion of our policy for determining the collectability of Private Education Loans
and maintaining our allowance for Private Education Loan losses, see “Critical Accounting Policies and
Estimates — Allowance for Loan Losses.”
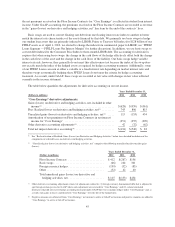
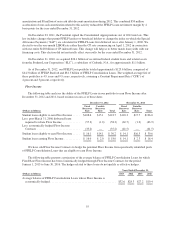
Servicing Revenue and Other Income — Consumer Lending Segment
Servicing revenue for our Consumer Lending segment primarily includes late fees. For the years ended
December 31, 2012, 2011 and 2010, servicing revenue for our Consumer Lending segment totaled $46 million,
$64 million and $72 million, respectively. Included in other income for the year ended December 31, 2011 was a
$9 million mark-to-market loss related to classifying our entire $12 million portfolio of non-U.S. dollar-
denominated student loans as held-for-sale.
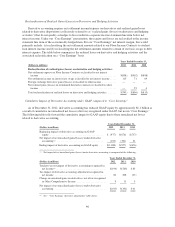
Operating Expenses — Consumer Lending Segment
Operating expenses for our Consumer Lending segment include costs incurred to originate Private
Education Loans and to service and collect on our Private Education Loan portfolio. For the years ended
December 31, 2012, 2011 and 2010, operating expenses for our Consumer Lending segment totaled
$265 million, $304 million and $350 million, respectively. The decrease in operating expenses over the past two
years was primarily the result of our cost-cutting initiatives. Operating expenses, excluding restructuring-related
asset impairments, were 70 basis points, 82 basis points and 96 basis points of average Private Education Loans
in the years ended December 31, 2012, 2011, and 2010, respectively.
50