Sallie Mae 2012 Annual Report Download - page 187
Download and view the complete annual report
Please find page 187 of the 2012 Sallie Mae annual report below. You can navigate through the pages in the report by either clicking on the pages listed below, or by using the keyword search tool below to find specific information within the annual report.-
 1
1 -
2
-
3
-
4
-
5
-
6
-
7
-
8
-
9
-
10
-
11
-
12
-
13
-
14
-
15
-
16
-
17
-
18
-
19
-
20
-
21
-
22
-
23
-
24
-
25
-
26
-
27
-
28
-
29
-
30
-
31
-
32
-
33
-
34
-
35
-
36
-
37
-
38
-
39
-
40
-
41
-
42
-
43
-
44
-
45
-
46
-
47
-
48
-
49
-
50
-
51
-
52
-
53
-
54
-
55
-
56
-
57
-
58
-
59
-
60
-
61
-
62
-
63
-
64
-
65
-
66
-
67
-
68
-
69
-
70
-
71
-
72
-
73
-
74
-
75
-
76
-
77
-
78
-
79
-
80
-
81
-
82
-
83
-
84
-
85
-
86
-
87
-
88
-
89
-
90
-
91
-
92
-
93
-
94
-
95
-
96
-
97
-
98
-
99
-
100
-
101
-
102
-
103
-
104
-
105
-
106
-
107
-
108
-
109
-
110
-
111
-
112
-
113
-
114
-
115
-
116
-
117
-
118
-
119
-
120
-
121
-
122
-
123
-
124
-
125
-
126
-
127
-
128
-
129
-
130
-
131
-
132
-
133
-
134
-
135
-
136
-
137
-
138
-
139
-
140
-
141
-
142
-
143
-
144
-
145
-
146
-
147
-
148
-
149
-
150
-
151
-
152
-
153
-
154
-
155
-
156
-
157
-
158
-
159
-
160
-
161
-
162
-
163
-
164
-
165
-
166
-
167
-
168
-
169
-
170
-
171
-
172
-
173
-
174
-
175
-
176
-
 177
177 -
 178
178 -
 179
179 -
 180
180 -
 181
181 -
 182
182 -
 183
183 -
 184
184 -
 185
185 -
 186
186 -
 187
187 -
 188
188 -
 189
189 -
 190
190 -
 191
191 -
 192
192 -
 193
193 -
 194
194 -
 195
195 -
 196
196 -
 197
197 -
198
-
199
-
200
-
201
-
202
-
203
-
204
-
205
-
206
-
207
 |
 |

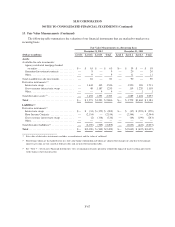
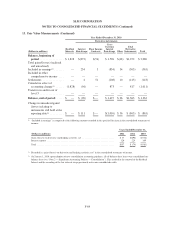
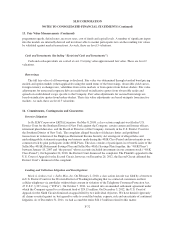
SLM CORPORATION
NOTES TO CONSOLIDATED FINANCIAL STATEMENTS (Continued)
16. Segment Reporting (Continued)
Since the beginning of 2006, virtually all of our Private Education Loans have been originated and funded
by the Bank, a Utah industrial bank subsidiary regulated by the UDFI and the FDIC. At December 31, 2012, the
Bank had total assets of $9.1 billion including $5.5 billion in Private Education Loans. As of the same date, the
Bank had total deposits of $7.8 billion. The Bank relies on both retail and brokered deposits to fund its assets and
periodically sells originated Private Education Loans to affiliates for inclusion in securitization trusts or
collection. The Bank is also a key component of our Campus Solutions, Upromise Rewards and college-savings
product businesses. Sallie Mae and its affiliates provide services and technology support to the Bank through
various service level agreements.
We face competition for Private Education Loans from a group of the nation’s larger banks and local credit
unions.
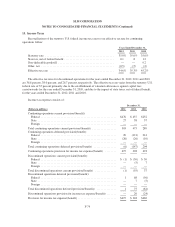
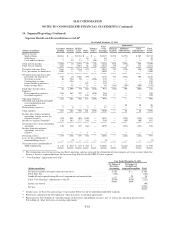
The following table includes asset information for our Consumer Lending segment.
December 31,
(Dollars in millions) 2012 2011
Private Education Loans, net ......................................... $36,934 $36,290
Cash and investments(1) ............................................. 2,731 3,113
Other ........................................................... 3,275 3,595
Total assets ...................................................... $42,940 $42,998
(1) Includes restricted cash and investments.
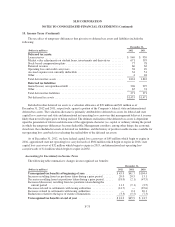
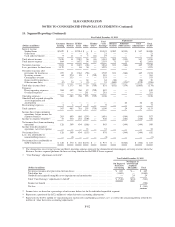
Business Services Segment
Our Business Services segment generates the majority of its revenue from servicing our FFELP Loan
portfolio and from performing servicing default aversion and contingency collections work on behalf of
Guarantors of FFELP Loans and other institutions. With the elimination of FFELP in July 2010, these FFELP-
related revenue sources will continue to decline.
• Servicing revenues from the FFELP Loans we own and manage represent intercompany charges to the
FFELP Loans segment at rates paid to us by the trusts which own the loans. These fees are legally the
first payment priority of the trusts and exceed the actual cost of servicing the loans. Intercompany loan
servicing revenues were $670 million in 2012 compared with $739 million in 2011. Intercompany loan
servicing revenues will decline as the FFELP Loan portfolio amortizes. Prepayments of FFELP Loans
could further accelerate the rate of decline.
• In 2012, we earned account maintenance fees and default aversion fees on FFELP Loans serviced for
Guarantors of $41 million, down from $46 million in 2011. These fees will continue to decline as the
portfolio amortizes. Prepayments of FFELP Loans could further accelerate the rate of decline.
• In 2012, contingency collection revenue from Guarantor clients totaled $264 million, compared to
$246 million from the prior year. We anticipate these revenues will begin to decline steadily in 2013.
F-77