Sallie Mae 2012 Annual Report Download - page 10
Download and view the complete annual report
Please find page 10 of the 2012 Sallie Mae annual report below. You can navigate through the pages in the report by either clicking on the pages listed below, or by using the keyword search tool below to find specific information within the annual report.-
 1
1 -
 2
2 -
 3
3 -
 4
4 -
 5
5 -
 6
6 -
 7
7 -
 8
8 -
 9
9 -
 10
10 -
 11
11 -
 12
12 -
 13
13 -
 14
14 -
 15
15 -
 16
16 -
 17
17 -
 18
18 -
 19
19 -
 20
20 -
 21
21 -
22
-
23
-
24
-
25
-
26
-
27
-
28
-
29
-
30
-
31
-
32
-
33
-
34
-
35
-
36
-
37
-
38
-
39
-
40
-
41
-
42
-
43
-
44
-
45
-
46
-
47
-
48
-
49
-
50
-
51
-
52
-
53
-
54
-
55
-
56
-
57
-
58
-
59
-
60
-
61
-
62
-
63
-
64
-
65
-
66
-
67
-
68
-
69
-
70
-
71
-
72
-
73
-
74
-
75
-
76
-
77
-
78
-
79
-
80
-
81
-
82
-
83
-
84
-
85
-
86
-
87
-
88
-
89
-
90
-
91
-
92
-
93
-
94
-
95
-
96
-
97
-
98
-
99
-
100
-
101
-
102
-
103
-
104
-
105
-
106
-
107
-
108
-
109
-
110
-
111
-
112
-
113
-
114
-
115
-
116
-
117
-
118
-
119
-
120
-
121
-
122
-
123
-
124
-
125
-
126
-
127
-
128
-
129
-
130
-
131
-
132
-
133
-
134
-
135
-
136
-
137
-
138
-
139
-
140
-
141
-
142
-
143
-
144
-
145
-
146
-
147
-
148
-
149
-
150
-
151
-
152
-
153
-
154
-
155
-
156
-
157
-
158
-
159
-
160
-
161
-
162
-
163
-
164
-
165
-
166
-
167
-
168
-
169
-
170
-
171
-
172
-
173
-
174
-
175
-
176
-
177
-
178
-
179
-
180
-
181
-
182
-
183
-
184
-
185
-
186
-
187
-
188
-
189
-
190
-
191
-
192
-
193
-
194
-
195
-
196
-
197
-
198
-
199
-
200
-
201
-
202
-
203
-
204
-
205
-
206
-
207
 |
 |
deposit funding or the interest rates we charge other than those restrictions generally applicable to all equally
situated banks. At the time of this filing, however, the Bank continues to be the subject of a cease and desist
order for previously identified weaknesses in its compliance function. While the issues addressed in the order
have largely been remediated, the order has not yet been lifted. Our failure to comply with various laws and
regulations, the terms of the cease and desist order, or to timely address issues raised during any examination
could result in limitations on our ability to obtain deposit funding in the Bank.
We face competition for Private Education Loans from a group of the nation’s larger banks and local credit
unions.
Business Services Segment
FFELP - Related Revenues
Our Business Services segment generates the majority of its revenue from servicing our FFELP Loan
portfolio and from performing servicing, default aversion and contingency collections work on behalf of
Guarantors of FFELP Loans and other institutions. With the elimination of FFELP in July 2010, these FFELP-
related revenue sources will continue to decline.
• Servicing revenues from the FFELP Loans we own and manage represent intercompany charges to the
FFELP Loans segment at rates paid to us by the trusts which own the loans. These fees are legally the
first payment priority of the trusts and exceed the actual cost of servicing the loans. Intercompany loan
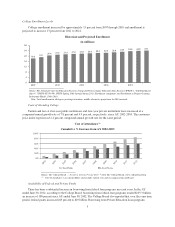
servicing revenues declined to $670 million in 2012 from $739 million in 2011. Intercompany loan
servicing revenues will decline as the FFELP portfolio amortizes. Prepayments of FFELP Loans could
further accelerate the rate of decline.
• In 2012, we earned account maintenance and default aversion fees on FFELP Loans serviced for
Guarantors of $41 million, down from $46 million in 2010. These fees will continue to decline as the
portfolio amortizes. Prepayments of FFELP Loans could further accelerate the rate of decline.
• In 2012, contingency collection revenue from Guarantor clients totaled $264 million, compared to $246
million the prior year. We anticipate these revenues will begin to decline steadily in 2013.
In 2012, our FFELP-related revenues accounted for 76 percent of total Business Services segment revenues,
as compared with 76 percent and 78 percent, respectively, for the previous two years. Total Business Services
segment revenues were $1.3 billion for the year ended December 31, 2012, down from $1.4 billion for the prior
year. Over the next several years our objective is to grow or acquire additional sources of services revenue. The
total amounts of these combined FFELP-related revenues, as well as the margins we earn from them, are
significant. Our ability to offset these increasing FFELP-related revenue declines is less certain.
The end of the FFELP program will likely cause owners of FFELP Loan portfolios as well as Guarantors of
those loans to seek to further reduce their FFELP servicing costs or sell those portfolios. Given the volume of
FFELP Loans we service for our affiliates and third parties, we are uniquely situated to adapt to the increasing
levels of education loan-specific disclosure, compliance, servicing and collection standards which other financial
institutions and servicers may not find economical to continue to support. Acquiring additional FFELP servicing
volume as others sell FFELP portfolios, exit existing FFELP servicing businesses or seek to find lower cost
providers for those services is a key component of our current Business Services growth strategy,
notwithstanding the end of the FFELP program.
We will also continue to pursue acquisitions of both complementary and diversified service businesses that
can expand demand for our services in and beyond the education loan markets. We considered several such
opportunities in 2012 but chose not to pursue those based on relative valuations of the companies and questions
regarding their near-term returns on investment as compared to other uses for our capital resources.
8