Sallie Mae 2012 Annual Report Download - page 51
Download and view the complete annual report
Please find page 51 of the 2012 Sallie Mae annual report below. You can navigate through the pages in the report by either clicking on the pages listed below, or by using the keyword search tool below to find specific information within the annual report.-
 1
1 -
2
-
3
-
4
-
5
-
6
-
7
-
8
-
9
-
10
-
11
-
12
-
13
-
14
-
15
-
16
-
17
-
18
-
19
-
20
-
21
-
22
-
23
-
24
-
25
-
26
-
27
-
28
-
29
-
30
-
31
-
32
-
33
-
34
-
35
-
36
-
37
-
38
-
39
-
40
-
 41
41 -
 42
42 -
 43
43 -
 44
44 -
 45
45 -
 46
46 -
 47
47 -
 48
48 -
 49
49 -
 50
50 -
 51
51 -
 52
52 -
 53
53 -
 54
54 -
 55
55 -
 56
56 -
 57
57 -
 58
58 -
 59
59 -
 60
60 -
 61
61 -
62
-
63
-
64
-
65
-
66
-
67
-
68
-
69
-
70
-
71
-
72
-
73
-
74
-
75
-
76
-
77
-
78
-
79
-
80
-
81
-
82
-
83
-
84
-
85
-
86
-
87
-
88
-
89
-
90
-
91
-
92
-
93
-
94
-
95
-
96
-
97
-
98
-
99
-
100
-
101
-
102
-
103
-
104
-
105
-
106
-
107
-
108
-
109
-
110
-
111
-
112
-
113
-
114
-
115
-
116
-
117
-
118
-
119
-
120
-
121
-
122
-
123
-
124
-
125
-
126
-
127
-
128
-
129
-
130
-
131
-
132
-
133
-
134
-
135
-
136
-
137
-
138
-
139
-
140
-
141
-
142
-
143
-
144
-
145
-
146
-
147
-
148
-
149
-
150
-
151
-
152
-
153
-
154
-
155
-
156
-
157
-
158
-
159
-
160
-
161
-
162
-
163
-
164
-
165
-
166
-
167
-
168
-
169
-
170
-
171
-
172
-
173
-
174
-
175
-
176
-
177
-
178
-
179
-
180
-
181
-
182
-
183
-
184
-
185
-
186
-
187
-
188
-
189
-
190
-
191
-
192
-
193
-
194
-
195
-
196
-
197
-
198
-
199
-
200
-
201
-
202
-
203
-
204
-
205
-
206
-
207
 |
 |

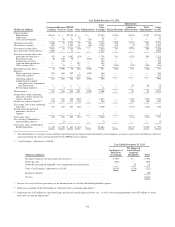
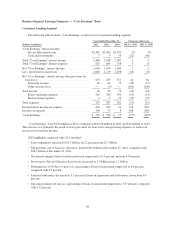
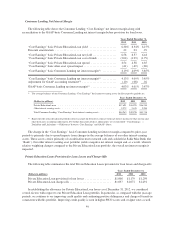
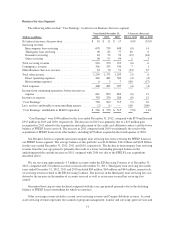
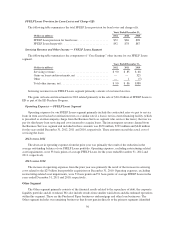
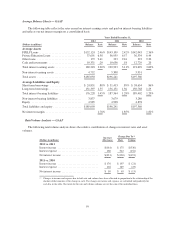
Consumer Lending Net Interest Margin
The following table shows the Consumer Lending “Core Earnings” net interest margin along with
reconciliation to the GAAP-basis Consumer Lending net interest margin before provision for loan losses.
Years Ended December 31,
2012 2011 2010
“Core Earnings” basis Private Education Loan yield ................... 6.36% 6.34% 6.15%
Discount amortization ........................................... .22 .23 .29
“Core Earnings” basis Private Education Loan net yield ................. 6.58 6.57 6.44
“Core Earnings” basis Private Education Loan cost of funds ............. (2.04) (1.99) (1.79)
“Core Earnings” basis Private Education Loan spread .................. 4.54 4.58 4.65
“Core Earnings” basis other asset spread impact ....................... (.41) (.49) (.80)
“Core Earnings” basis Consumer Lending net interest margin(1) .......... 4.13% 4.09% 3.85%
“Core Earnings” basis Consumer Lending net interest margin(1) .......... 4.13% 4.09% 3.85%
Adjustment for GAAP accounting treatment(2) ........................ (.10) (.08) .02
GAAP-basis Consumer Lending net interest margin(1) .................. 4.03% 4.01% 3.87%
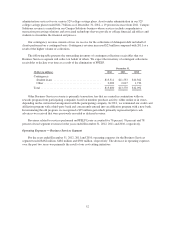
(1) The average balances of our Consumer Lending “Core Earnings” basis interest-earning assets for the respective periods are:
Years Ended December 31,
(Dollars in millions) 2012 2011 2010
Private Education Loans ................................................... $37,691 $36,955 $36,534
Other interest-earning assets ................................................ 2,572 3,015 5,204
Total Consumer Lending “Core Earnings” basis interest-earning assets .............. $40,263 $39,970 $41,738
(2) Represents the reclassification of periodic interest accruals on derivative contracts from net interest income to other income and
other derivative accounting adjustments. For further discussion of these adjustments, see section titled “‘Core Earnings’ —
Definition and Limitations — Differences between ‘Core Earnings’ and GAAP” above.
The change in the “Core Earnings” basis Consumer Lending net interest margin compared to prior-year
periods is primarily due to spread impacts from changes in the average balances of our other interest-earning
assets. These assets consist primarily of securitization trust restricted cash and cash held at Sallie Mae Bank (the
“Bank”). Our other interest-earning asset portfolio yields a negative net interest margin and, as a result, when its
relative weighting changes compared to the Private Education Loan portfolio, the overall net interest margin is
impacted.
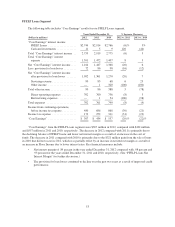
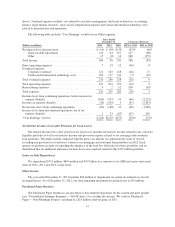
Private Education Loans Provision for Loan Losses and Charge-Offs
The following table summarizes the total Private Education Loans provision for loan losses and charge-offs.
Years Ended December 31,
(Dollars in millions) 2012 2011 2010
Private Education Loan provision for loan losses .................. $1,008 $1,179 $1,298
Private Education Loan charge-offs ............................. $1,037 $1,072 $1,291
In establishing the allowance for Private Education Loan losses as of December 31, 2012, we considered
several factors with respect to our Private Education Loan portfolio. In particular, as compared with the year-ago
periods, we continue to see improving credit quality and continuing positive delinquency and charge-off trends in
connection with this portfolio. Improving credit quality is seen in higher FICO scores and cosigner rates as well
49