Sallie Mae 2012 Annual Report Download - page 177
Download and view the complete annual report
Please find page 177 of the 2012 Sallie Mae annual report below. You can navigate through the pages in the report by either clicking on the pages listed below, or by using the keyword search tool below to find specific information within the annual report.-
 1
1 -
2
-
3
-
4
-
5
-
6
-
7
-
8
-
9
-
10
-
11
-
12
-
13
-
14
-
15
-
16
-
17
-
18
-
19
-
20
-
21
-
22
-
23
-
24
-
25
-
26
-
27
-
28
-
29
-
30
-
31
-
32
-
33
-
34
-
35
-
36
-
37
-
38
-
39
-
40
-
41
-
42
-
43
-
44
-
45
-
46
-
47
-
48
-
49
-
50
-
51
-
52
-
53
-
54
-
55
-
56
-
57
-
58
-
59
-
60
-
61
-
62
-
63
-
64
-
65
-
66
-
67
-
68
-
69
-
70
-
71
-
72
-
73
-
74
-
75
-
76
-
77
-
78
-
79
-
80
-
81
-
82
-
83
-
84
-
85
-
86
-
87
-
88
-
89
-
90
-
91
-
92
-
93
-
94
-
95
-
96
-
97
-
98
-
99
-
100
-
101
-
102
-
103
-
104
-
105
-
106
-
107
-
108
-
109
-
110
-
111
-
112
-
113
-
114
-
115
-
116
-
117
-
118
-
119
-
120
-
121
-
122
-
123
-
124
-
125
-
126
-
127
-
128
-
129
-
130
-
131
-
132
-
133
-
134
-
135
-
136
-
137
-
138
-
139
-
140
-
141
-
142
-
143
-
144
-
145
-
146
-
147
-
148
-
149
-
150
-
151
-
152
-
153
-
154
-
155
-
156
-
157
-
158
-
159
-
160
-
161
-
162
-
163
-
164
-
165
-
166
-
 167
167 -
 168
168 -
 169
169 -
 170
170 -
 171
171 -
 172
172 -
 173
173 -
 174
174 -
 175
175 -
 176
176 -
 177
177 -
 178
178 -
 179
179 -
 180
180 -
 181
181 -
 182
182 -
 183
183 -
 184
184 -
 185
185 -
 186
186 -
 187
187 -
188
-
189
-
190
-
191
-
192
-
193
-
194
-
195
-
196
-
197
-
198
-
199
-
200
-
201
-
202
-
203
-
204
-
205
-
206
-
207
 |
 |

SLM CORPORATION
NOTES TO CONSOLIDATED FINANCIAL STATEMENTS (Continued)
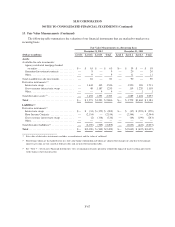
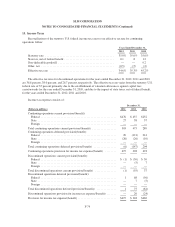
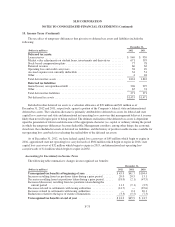
13. Fair Value Measurements (Continued)
The following table summarizes the valuation of our financial instruments that are marked-to-market on a
recurring basis.
Fair Value Measurements on a Recurring Basis
December 31, 2012 December 31, 2011
(Dollars in millions) Level 1 Level 2 Level 3 Total Level 1 Level 2 Level 3 Total
Assets
Available-for-sale investments:
Agency residential mortgage-backed
securities ............................ $— $ 63 $ — $ 63 $— $ 59 $ — $ 59
Guaranteed investment contracts ........... — 9 — 9 — 20 — 20
Other ................................. — 9 — 9 — 11 — 11
Total available-for-sale investments .......... — 81 — 81 — 90 — 90
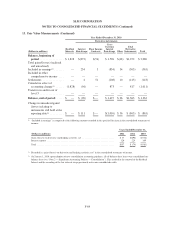
Derivative instruments:(1)
Interest rate swaps ...................... — 1,444 102 1,546 — 1,550 183 1,733
Cross currency interest rate swaps .......... — 48 1,187 1,235 — 139 1,220 1,359
Other ................................. — — 4 4 — — 1 1
Total derivative assets(3) .................... — 1,492 1,293 2,785 — 1,689 1,404 3,093
Total ................................... $— $1,573 $1,293 $ 2,866 $— $ 1,779 $1,404 $ 3,183
Liabilities(2)
Derivative instruments(1)
Interest rate swaps ...................... $— $ (34) $ (175) $ (209) $— $ (47) $ (223) $ (270)
Floor Income Contracts .................. — (2,154) — (2,154) — (2,544) — (2,544)
Cross currency interest rate swaps .......... — (2) (134) (136) — (44) (199) (243)
Other ................................. — — — — — — — —
Total derivative liabilities(3) ................. — (2,190) (309) (2,499) — (2,635) (422) (3,057)
Total ................................... $— $(2,190) $ (309) $(2,499) $— $(2,635) $ (422) $(3,057)
(1) Fair value of derivative instruments excludes accrued interest and the value of collateral.
(2) Borrowings which are the hedged items in a fair value hedge relationship and which are adjusted for changes in value due to benchmark
interest rates only are not carried at full fair value and are not reflected in this table.
(3) See “Note 7 — Derivative Financial Instruments” for a reconciliation of gross positions without the impact of master netting agreements
to the balance sheet classification.
F-67