Sallie Mae 2012 Annual Report Download - page 70
Download and view the complete annual report
Please find page 70 of the 2012 Sallie Mae annual report below. You can navigate through the pages in the report by either clicking on the pages listed below, or by using the keyword search tool below to find specific information within the annual report.-
 1
1 -
2
-
3
-
4
-
5
-
6
-
7
-
8
-
9
-
10
-
11
-
12
-
13
-
14
-
15
-
16
-
17
-
18
-
19
-
20
-
21
-
22
-
23
-
24
-
25
-
26
-
27
-
28
-
29
-
30
-
31
-
32
-
33
-
34
-
35
-
36
-
37
-
38
-
39
-
40
-
41
-
42
-
43
-
44
-
45
-
46
-
47
-
48
-
49
-
50
-
51
-
52
-
53
-
54
-
55
-
56
-
57
-
58
-
59
-
 60
60 -
 61
61 -
 62
62 -
 63
63 -
 64
64 -
 65
65 -
 66
66 -
 67
67 -
 68
68 -
 69
69 -
 70
70 -
 71
71 -
 72
72 -
 73
73 -
 74
74 -
 75
75 -
 76
76 -
 77
77 -
 78
78 -
 79
79 -
 80
80 -
81
-
82
-
83
-
84
-
85
-
86
-
87
-
88
-
89
-
90
-
91
-
92
-
93
-
94
-
95
-
96
-
97
-
98
-
99
-
100
-
101
-
102
-
103
-
104
-
105
-
106
-
107
-
108
-
109
-
110
-
111
-
112
-
113
-
114
-
115
-
116
-
117
-
118
-
119
-
120
-
121
-
122
-
123
-
124
-
125
-
126
-
127
-
128
-
129
-
130
-
131
-
132
-
133
-
134
-
135
-
136
-
137
-
138
-
139
-
140
-
141
-
142
-
143
-
144
-
145
-
146
-
147
-
148
-
149
-
150
-
151
-
152
-
153
-
154
-
155
-
156
-
157
-
158
-
159
-
160
-
161
-
162
-
163
-
164
-
165
-
166
-
167
-
168
-
169
-
170
-
171
-
172
-
173
-
174
-
175
-
176
-
177
-
178
-
179
-
180
-
181
-
182
-
183
-
184
-
185
-
186
-
187
-
188
-
189
-
190
-
191
-
192
-
193
-
194
-
195
-
196
-
197
-
198
-
199
-
200
-
201
-
202
-
203
-
204
-
205
-
206
-
207
 |
 |

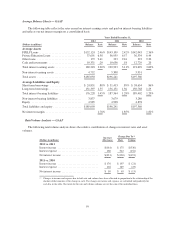
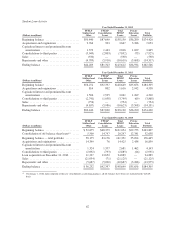
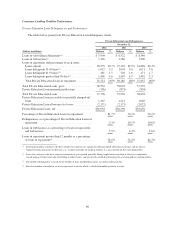
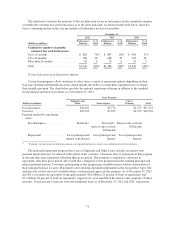
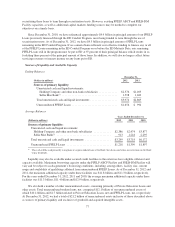
The following tables provide the detail for our traditional and non-traditional “Core Earnings” basis Private
Education Loans for the respective years ended.
December 31, 2012 December 31, 2011 December 31, 2010
(Dollars in millions) Traditional
Non-
Traditional Total Traditional
Non-
Traditional Total Traditional
Non-
Traditional Total
Ending total loans(1) ..... $36,144 $3,757 $39,901 $35,233 $4,101 $39,334 $34,177 $4,395 $38,572
Ending loans in
repayment ........... 28,930 2,584 31,514 27,467 2,718 30,185 25,043 2,809 27,852
Private Education Loan
allowance for loan
losses .............. 1,637 534 2,171 1,542 629 2,171 1,231 791 2,022
Charge-offs as a
percentage of average
loans in repayment .... 2.7% 10.9% 3.4% 2.8% 12.3% 3.7% 3.6% 16.8% 5.0%
Allowance as a percentage
of ending total loans . . . 4.5% 14.2% 5.4% 4.4% 15.3% 5.5% 3.6% 18.0% 5.2%
Allowance as a percentage
of ending loans in
repayment ........... 5.7% 20.7% 6.9% 5.6% 23.1% 7.2% 4.9% 28.2% 7.3%
Average coverage of
charge-offs .......... 2.2 1.9 2.1 2.1 1.9 2.0 1.5 1.7 1.6
Delinquencies as a
percentage of Private
Education Loans in
repayment ........... 8.1% 23.4% 9.3% 8.6% 26.0% 10.1% 8.8% 27.4% 10.6%
Delinquencies greater than
90 days as a percentage
of Private Education
Loans in repayment . . . 3.9% 12.6% 4.6% 4.0% 13.6% 4.9% 4.2% 15.0% 5.3%
Loans in forbearance as a
percentage of loans in
repayment and
forbearance .......... 3.3% 5.1% 3.5% 4.2% 6.6% 4.4% 4.4% 6.1% 4.6%
Loans that entered
repayment during the
period(2) ............. $ 3,336 $ 194 $ 3,530 $ 4,886 $ 345 $ 5,231 $ 6,451 $ 553 $ 7,004
Percentage of Private
Education Loans with a
cosigner ............ 68% 30% 65% 65% 29% 62% 63% 28% 59%
Average FICO at
origination .......... 728 624 720 726 624 717 725 623 715
(1) Ending total loans represent gross Private Education Loans, plus the receivable for partially charged-off loans.
(2) Includes loans that are required to make a payment for the first time.
68