Sallie Mae 2012 Annual Report Download - page 148
Download and view the complete annual report
Please find page 148 of the 2012 Sallie Mae annual report below. You can navigate through the pages in the report by either clicking on the pages listed below, or by using the keyword search tool below to find specific information within the annual report.-
 1
1 -
2
-
3
-
4
-
5
-
6
-
7
-
8
-
9
-
10
-
11
-
12
-
13
-
14
-
15
-
16
-
17
-
18
-
19
-
20
-
21
-
22
-
23
-
24
-
25
-
26
-
27
-
28
-
29
-
30
-
31
-
32
-
33
-
34
-
35
-
36
-
37
-
38
-
39
-
40
-
41
-
42
-
43
-
44
-
45
-
46
-
47
-
48
-
49
-
50
-
51
-
52
-
53
-
54
-
55
-
56
-
57
-
58
-
59
-
60
-
61
-
62
-
63
-
64
-
65
-
66
-
67
-
68
-
69
-
70
-
71
-
72
-
73
-
74
-
75
-
76
-
77
-
78
-
79
-
80
-
81
-
82
-
83
-
84
-
85
-
86
-
87
-
88
-
89
-
90
-
91
-
92
-
93
-
94
-
95
-
96
-
97
-
98
-
99
-
100
-
101
-
102
-
103
-
104
-
105
-
106
-
107
-
108
-
109
-
110
-
111
-
112
-
113
-
114
-
115
-
116
-
117
-
118
-
119
-
120
-
121
-
122
-
123
-
124
-
125
-
126
-
127
-
128
-
129
-
130
-
131
-
132
-
133
-
134
-
135
-
136
-
137
-
 138
138 -
 139
139 -
 140
140 -
 141
141 -
 142
142 -
 143
143 -
 144
144 -
 145
145 -
 146
146 -
 147
147 -
 148
148 -
 149
149 -
 150
150 -
 151
151 -
 152
152 -
 153
153 -
 154
154 -
 155
155 -
 156
156 -
 157
157 -
 158
158 -
159
-
160
-
161
-
162
-
163
-
164
-
165
-
166
-
167
-
168
-
169
-
170
-
171
-
172
-
173
-
174
-
175
-
176
-
177
-
178
-
179
-
180
-
181
-
182
-
183
-
184
-
185
-
186
-
187
-
188
-
189
-
190
-
191
-
192
-
193
-
194
-
195
-
196
-
197
-
198
-
199
-
200
-
201
-
202
-
203
-
204
-
205
-
206
-
207
 |
 |

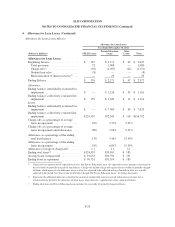
SLM CORPORATION
NOTES TO CONSOLIDATED FINANCIAL STATEMENTS (Continued)
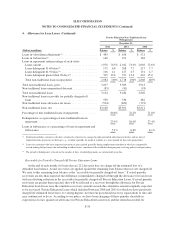
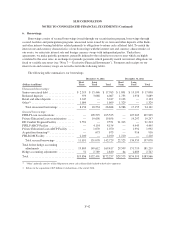
4. Allowance for Loan Losses (Continued)
The following tables provide information regarding the loan status and aging of TDR loans that are past due.
TDR Loan Delinquencies
December 31,
2012 2011 2010
(Dollars in millions) Balance % Balance % Balance %
Loans in deferment(1) ................................... $ 574 $ 285 $ 16
Loans in forbearance(2) ................................. 544 696 12
Loans in repayment and percentage of each status:
Loans current ....................................... 4,619 73.8% 3,018 69.7% 281 67.7%
Loans delinquent 31-60 days(3) ......................... 478 7.6 427 9.8 33 7.9
Loans delinquent 61-90 days(3) ......................... 254 4.1 215 5.0 24 5.7
Loans delinquent greater than 90 days(3) .................. 908 14.5 672 15.5 78 18.7
Total TDR loans in repayment ......................... 6,259 100% 4,332 100% 416 100%
Total TDR loans, gross ................................. $7,377 $5,313 $444
(1) Loans for customers who have requested and qualify for permitted program deferments such as military, unemployment, or economic
hardships.
(2) Loans for customers who have used their allowable deferment time or do not qualify for deferment, that need additional time to obtain
employment or who have temporarily ceased making full payments due to hardship or other factors.
(3) The period of delinquency is based on the number of days scheduled payments are contractually past due.
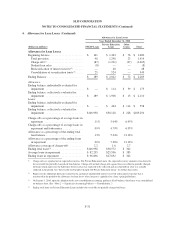
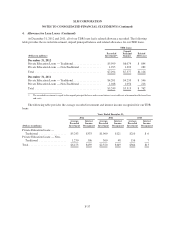
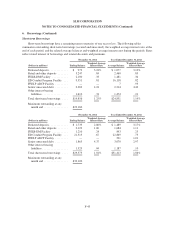
The following table provides the amount of modified loans that resulted in a TDR in the periods presented.
Additionally, the table summarizes charge-offs occurring in the TDR portfolio, as well as TDRs for which a
payment default occurred in the current period within 12 months of the loan first being designated as a TDR. We
define payment default as 60 days past due for this disclosure. The majority of our loans that are considered
TDRs involve a temporary forbearance of payments and do not change the contractual interest rate of the loan.
Years Ended December 31,
2012 2011 2010
(Dollars in millions)
Modified
Loans(1)
Charge-
Offs(2)
Payment-
Default
Modified
Loans(1)
Charge-
Offs(2)
Payment-
Default
Modified
Loans(1)
Charge-
Offs(2)
Payment-
Default
Private Education
Loans —
Traditional ....... $2,375 $389 $1,351 $4,103 $ 99 $1,036 $171 $18 $50
Private Education
Loans — Non-
Traditional ....... 443 152 420 951 55 414 106 25 39
Total ......... $2,818 $541 $1,771 $5,054 $154 $1,450 $277 $43 $89
(1) Represents period ending balance of loans that have been modified during the period and resulted in a TDR.
(2) Represents loans that charged off that were classified as TDRs.
F-38