Sallie Mae 2012 Annual Report Download - page 58
Download and view the complete annual report
Please find page 58 of the 2012 Sallie Mae annual report below. You can navigate through the pages in the report by either clicking on the pages listed below, or by using the keyword search tool below to find specific information within the annual report.-
 1
1 -
2
-
3
-
4
-
5
-
6
-
7
-
8
-
9
-
10
-
11
-
12
-
13
-
14
-
15
-
16
-
17
-
18
-
19
-
20
-
21
-
22
-
23
-
24
-
25
-
26
-
27
-
28
-
29
-
30
-
31
-
32
-
33
-
34
-
35
-
36
-
37
-
38
-
39
-
40
-
41
-
42
-
43
-
44
-
45
-
46
-
47
-
 48
48 -
 49
49 -
 50
50 -
 51
51 -
 52
52 -
 53
53 -
 54
54 -
 55
55 -
 56
56 -
 57
57 -
 58
58 -
 59
59 -
 60
60 -
 61
61 -
 62
62 -
 63
63 -
 64
64 -
 65
65 -
 66
66 -
 67
67 -
 68
68 -
69
-
70
-
71
-
72
-
73
-
74
-
75
-
76
-
77
-
78
-
79
-
80
-
81
-
82
-
83
-
84
-
85
-
86
-
87
-
88
-
89
-
90
-
91
-
92
-
93
-
94
-
95
-
96
-
97
-
98
-
99
-
100
-
101
-
102
-
103
-
104
-
105
-
106
-
107
-
108
-
109
-
110
-
111
-
112
-
113
-
114
-
115
-
116
-
117
-
118
-
119
-
120
-
121
-
122
-
123
-
124
-
125
-
126
-
127
-
128
-
129
-
130
-
131
-
132
-
133
-
134
-
135
-
136
-
137
-
138
-
139
-
140
-
141
-
142
-
143
-
144
-
145
-
146
-
147
-
148
-
149
-
150
-
151
-
152
-
153
-
154
-
155
-
156
-
157
-
158
-
159
-
160
-
161
-
162
-
163
-
164
-
165
-
166
-
167
-
168
-
169
-
170
-
171
-
172
-
173
-
174
-
175
-
176
-
177
-
178
-
179
-
180
-
181
-
182
-
183
-
184
-
185
-
186
-
187
-
188
-
189
-
190
-
191
-
192
-
193
-
194
-
195
-
196
-
197
-
198
-
199
-
200
-
201
-
202
-
203
-
204
-
205
-
206
-
207
 |
 |

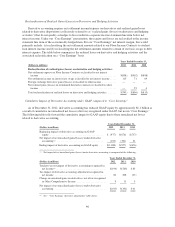
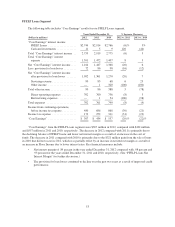
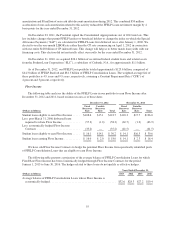
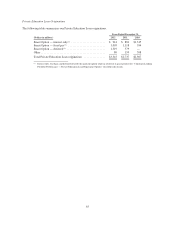
FFELP Loans Provision for Loan Losses and Charge-Offs
The following table summarizes the total FFELP Loan provision for loan losses and charge-offs.
Years Ended December 31,
(Dollars in millions) 2012 2011 2010
FFELP Loan provision for loan losses ..................... $72 $86 $98
FFELP Loan charge-offs ............................... $92 $78 $87
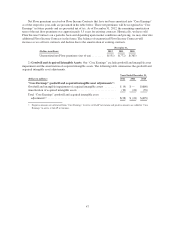
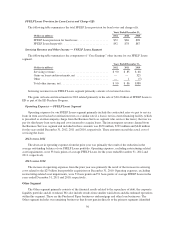
Servicing Revenue and Other Income — FFELP Loans Segment
The following table summarizes the components of “Core Earnings” other income for our FFELP Loans
segment.
Years Ended December 31,
(Dollars in millions) 2012 2011 2010
Servicing revenue ..................................... $ 90 $ 85 $ 68
Gains on loans and investments, net ...................... — — 325
Other ............................................... — 1 (5)
Total other income, net ................................. $ 90 $ 86 $388
Servicing revenue for our FFELP Loans segment primarily consists of customer late fees.
The gains on loans and investments in 2010 related primarily to the sale of $20.4 billion of FFELP Loans to
ED as part of the ED Purchase Program.
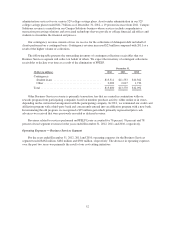
Operating Expenses — FFELP Loans Segment
Operating expenses for our FFELP Loans segment primarily include the contractual rates we pay to service
loans in term asset-backed securitization trusts or a similar rate if a loan is not in a term financing facility (which
is presented as an intercompany charge from the Business Services segment who services the loans), the fees we
pay for third-party loan servicing and costs incurred to acquire loans. The intercompany revenue charged from
the Business Services segment and included in those amounts was $670 million, $739 million and $648 million
for the years ended December 31, 2012, 2011 and 2010, respectively. These amounts exceed the actual cost of
servicing the loans.
2012 versus 2011
The decrease in operating expenses from the prior year was primarily the result of the reduction in the
average outstanding balance of our FFELP Loans portfolio. Operating expenses, excluding restructuring-related
asset impairments, were 53 basis points of average FFELP Loans for the years ended December 31, 2012 and
2011, respectively.
2011 versus 2010
The increase in operating expenses from the prior year was primarily the result of the increase in servicing
costs related to the $25 billion loan portfolio acquisition on December 31, 2010. Operating expenses, excluding
restructuring-related asset impairments, were 53 basis points and 51 basis points of average FFELP Loans in the
years ended December 31, 2011 and 2010, respectively.
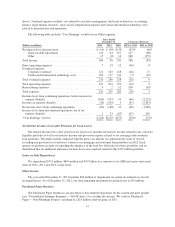
Other Segment
The Other segment primarily consists of the financial results related to the repurchase of debt, the corporate
liquidity portfolio and all overhead. We also include results from smaller wind-down and discontinued operations
within this segment. These are the Purchased Paper businesses and mortgage and other loan businesses. The
Other segment includes our remaining businesses that do not pertain directly to the primary segments identified
56