Sallie Mae 2012 Annual Report Download - page 63
Download and view the complete annual report
Please find page 63 of the 2012 Sallie Mae annual report below. You can navigate through the pages in the report by either clicking on the pages listed below, or by using the keyword search tool below to find specific information within the annual report.-
 1
1 -
2
-
3
-
4
-
5
-
6
-
7
-
8
-
9
-
10
-
11
-
12
-
13
-
14
-
15
-
16
-
17
-
18
-
19
-
20
-
21
-
22
-
23
-
24
-
25
-
26
-
27
-
28
-
29
-
30
-
31
-
32
-
33
-
34
-
35
-
36
-
37
-
38
-
39
-
40
-
41
-
42
-
43
-
44
-
45
-
46
-
47
-
48
-
49
-
50
-
51
-
52
-
 53
53 -
 54
54 -
 55
55 -
 56
56 -
 57
57 -
 58
58 -
 59
59 -
 60
60 -
 61
61 -
 62
62 -
 63
63 -
 64
64 -
 65
65 -
 66
66 -
 67
67 -
 68
68 -
 69
69 -
 70
70 -
 71
71 -
 72
72 -
 73
73 -
74
-
75
-
76
-
77
-
78
-
79
-
80
-
81
-
82
-
83
-
84
-
85
-
86
-
87
-
88
-
89
-
90
-
91
-
92
-
93
-
94
-
95
-
96
-
97
-
98
-
99
-
100
-
101
-
102
-
103
-
104
-
105
-
106
-
107
-
108
-
109
-
110
-
111
-
112
-
113
-
114
-
115
-
116
-
117
-
118
-
119
-
120
-
121
-
122
-
123
-
124
-
125
-
126
-
127
-
128
-
129
-
130
-
131
-
132
-
133
-
134
-
135
-
136
-
137
-
138
-
139
-
140
-
141
-
142
-
143
-
144
-
145
-
146
-
147
-
148
-
149
-
150
-
151
-
152
-
153
-
154
-
155
-
156
-
157
-
158
-
159
-
160
-
161
-
162
-
163
-
164
-
165
-
166
-
167
-
168
-
169
-
170
-
171
-
172
-
173
-
174
-
175
-
176
-
177
-
178
-
179
-
180
-
181
-
182
-
183
-
184
-
185
-
186
-
187
-
188
-
189
-
190
-
191
-
192
-
193
-
194
-
195
-
196
-
197
-
198
-
199
-
200
-
201
-
202
-
203
-
204
-
205
-
206
-
207
 |
 |

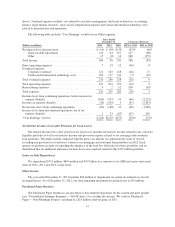
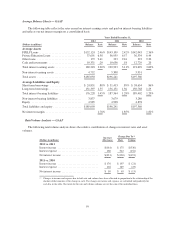
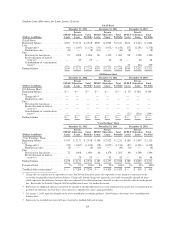
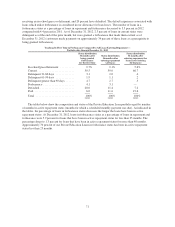
Average Student Loan Balances (net of unamortized premium/discount)
Year Ended December 31, 2012
(Dollars in millions)
FFELP
Stafford and
Other
FFELP
Consolidation
Loans
Total
FFELP
Loans
Private
Education
Loans
Total
Portfolio
Total ................................... $47,629 $84,495 $132,124 $37,691 $169,815
% of FFELP ......................... 36% 64% 100%
% of total ........................... 28% 50% 78% 22% 100%
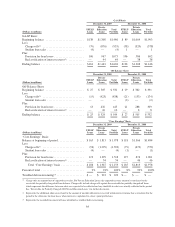
Year Ended December 31, 2011
(Dollars in millions)
FFELP
Stafford and
Other
FFELP
Consolidation
Loans
Total
FFELP
Loans
Private
Education
Loans
Total
Portfolio
Total ................................... $53,163 $89,946 $143,109 $36,955 $180,064
% of FFELP ......................... 37% 63% 100%
% of total ........................... 29% 50% 79% 21% 100%
Year Ended December 31, 2010
(Dollars in millions)
FFELP
Stafford and
Other
FFELP
Consolidation
Loans
Total
FFELP
Loans
Private
Education
Loans
Total
Portfolio
Total(1) .................................. $61,034 $81,009 $142,043 $36,534 $178,577
% of FFELP ......................... 43% 57% 100%
% of total ........................... 34% 46% 80% 20% 100%
(1) On January 1, 2010, upon the adoption of the new consolidation accounting guidance, all off-balance sheet loans were consolidated on-
balance sheet.
61