Sallie Mae 2012 Annual Report Download - page 36
Download and view the complete annual report
Please find page 36 of the 2012 Sallie Mae annual report below. You can navigate through the pages in the report by either clicking on the pages listed below, or by using the keyword search tool below to find specific information within the annual report.-
 1
1 -
2
-
3
-
4
-
5
-
6
-
7
-
8
-
9
-
10
-
11
-
12
-
13
-
14
-
15
-
16
-
17
-
18
-
19
-
20
-
21
-
22
-
23
-
24
-
25
-
 26
26 -
 27
27 -
 28
28 -
 29
29 -
 30
30 -
 31
31 -
 32
32 -
 33
33 -
 34
34 -
 35
35 -
 36
36 -
 37
37 -
 38
38 -
 39
39 -
 40
40 -
 41
41 -
 42
42 -
 43
43 -
 44
44 -
 45
45 -
 46
46 -
47
-
48
-
49
-
50
-
51
-
52
-
53
-
54
-
55
-
56
-
57
-
58
-
59
-
60
-
61
-
62
-
63
-
64
-
65
-
66
-
67
-
68
-
69
-
70
-
71
-
72
-
73
-
74
-
75
-
76
-
77
-
78
-
79
-
80
-
81
-
82
-
83
-
84
-
85
-
86
-
87
-
88
-
89
-
90
-
91
-
92
-
93
-
94
-
95
-
96
-
97
-
98
-
99
-
100
-
101
-
102
-
103
-
104
-
105
-
106
-
107
-
108
-
109
-
110
-
111
-
112
-
113
-
114
-
115
-
116
-
117
-
118
-
119
-
120
-
121
-
122
-
123
-
124
-
125
-
126
-
127
-
128
-
129
-
130
-
131
-
132
-
133
-
134
-
135
-
136
-
137
-
138
-
139
-
140
-
141
-
142
-
143
-
144
-
145
-
146
-
147
-
148
-
149
-
150
-
151
-
152
-
153
-
154
-
155
-
156
-
157
-
158
-
159
-
160
-
161
-
162
-
163
-
164
-
165
-
166
-
167
-
168
-
169
-
170
-
171
-
172
-
173
-
174
-
175
-
176
-
177
-
178
-
179
-
180
-
181
-
182
-
183
-
184
-
185
-
186
-
187
-
188
-
189
-
190
-
191
-
192
-
193
-
194
-
195
-
196
-
197
-
198
-
199
-
200
-
201
-
202
-
203
-
204
-
205
-
206
-
207
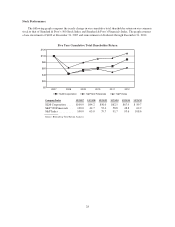
 |
 |
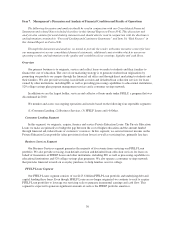
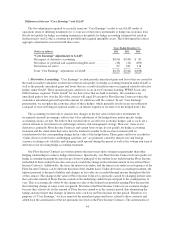
Sustain Business Services Segment Revenue
Our Business Services segment generates the majority of its net income from servicing and collecting on our
FFELP Loan portfolio and FFELP Loans for others. As a result of the elimination of FFELP in 2010, these
revenues are in decline. In 2012 we worked to offset these declines through two primary means — pursuing
additional growth and expansion of our non-FFELP-related servicing and collection businesses and seeking to
increase the FFELP-related loan servicing and collection work we do for third parties. In 2012 we also targeted
significant growth in the total assets under management in our 529 college-savings plans. For the year ended
December 31, 2012, our Business Services segment revenue was down 5 percent from the year-ago period
primarily due to the amortization of our FFELP Loan portfolio. While we considered several servicing
acquisitions beyond the education loan market we chose not to pursue them. Nonetheless, in 2012 we did achieve
meaningful growth in a number of Business Services activities:
• We are currently servicing approximately 4.3 million accounts under the ED Servicing Contract as of
December 31, 2012 compared to 3.6 million accounts at December 31, 2011. Market share under the ED
Servicing Contract is set annually based on the performance rankings of the four servicing companies that
are parties to the contracts. For the current contract year ending August 15, 2013, our allocation of new
customer loans awarded under the ED Servicing Contract is 15 percent. We are not pleased with our
overall 2012 performance ranking and must remain focused on improving our performance relative to
other servicers to increase our allocation for the next contract year. We plan to make these improvements
by maintaining our focus on remaining a top performer in helping borrowers repay their loans and
enhancing our customer experience, as further discussed below in our 2013 Management Objectives.
• We provide collection services on defaulted student loans to ED. There are 21 other collection providers,
of which we compete with 16 other providers for account allocation based on quarterly performance
metrics. As a consistent top performer, first in the last quarterly performance metric, our share of
allocated accounts has ranged from six percent to eight percent.
Maximize Cash Flows from FFELP Loans
In 2012 we continued to purchase FFELP Loan portfolios from others. As cash flows from our existing
FFELP Loans decline it becomes increasingly important that we reduce operating and overhead costs attributable
to this segment. During 2012, we purchased $3.7 billion of FFELP Loans. We expect to make additional
purchases during 2013. These acquisitions partially offset the approximately $5.2 billion of loans that were
consolidated to ED in 2012 as part of their Special Direct Consolidation Loan Initiative (“SDCL”). See “Business
Segment Earnings Summary — “Core Earnings” Basis — FFELP Loans Segment” for further discussion
regarding the effect of the Special Direct Consolidation Loan Initiative.
Reduce Operating Expenses
In 2012 we remained focused on reducing operating expenses and achieved our 2012 cost-reduction goals.
Our 2012 operating expenses were $996 million, a reduction from the $1.1 billion incurred in 2011.
Improve Our Financial Strength
It was management’s objective for 2012 to provide increased shareholder distributions while at the same
time ending 2012 with a balance sheet and capital position as strong as or stronger than those with which we
ended in 2011. We increased our regular quarterly common stock dividends to $0.125 per share in 2012, up from
$0.10 per share for the last three quarters of 2011. During the year ended December 31, 2012, we repurchased
58 million shares of common stock, fully utilizing all $900 million of existing share repurchase authorizations.
We did so while achieving $2.16 diluted “Core Earnings” per common share and maintaining our strong balance
sheet and capital positions.
34