Sallie Mae 2012 Annual Report Download - page 79
Download and view the complete annual report
Please find page 79 of the 2012 Sallie Mae annual report below. You can navigate through the pages in the report by either clicking on the pages listed below, or by using the keyword search tool below to find specific information within the annual report.-
 1
1 -
2
-
3
-
4
-
5
-
6
-
7
-
8
-
9
-
10
-
11
-
12
-
13
-
14
-
15
-
16
-
17
-
18
-
19
-
20
-
21
-
22
-
23
-
24
-
25
-
26
-
27
-
28
-
29
-
30
-
31
-
32
-
33
-
34
-
35
-
36
-
37
-
38
-
39
-
40
-
41
-
42
-
43
-
44
-
45
-
46
-
47
-
48
-
49
-
50
-
51
-
52
-
53
-
54
-
55
-
56
-
57
-
58
-
59
-
60
-
61
-
62
-
63
-
64
-
65
-
66
-
67
-
68
-
 69
69 -
 70
70 -
 71
71 -
 72
72 -
 73
73 -
 74
74 -
 75
75 -
 76
76 -
 77
77 -
 78
78 -
 79
79 -
 80
80 -
 81
81 -
 82
82 -
 83
83 -
 84
84 -
 85
85 -
 86
86 -
 87
87 -
 88
88 -
 89
89 -
90
-
91
-
92
-
93
-
94
-
95
-
96
-
97
-
98
-
99
-
100
-
101
-
102
-
103
-
104
-
105
-
106
-
107
-
108
-
109
-
110
-
111
-
112
-
113
-
114
-
115
-
116
-
117
-
118
-
119
-
120
-
121
-
122
-
123
-
124
-
125
-
126
-
127
-
128
-
129
-
130
-
131
-
132
-
133
-
134
-
135
-
136
-
137
-
138
-
139
-
140
-
141
-
142
-
143
-
144
-
145
-
146
-
147
-
148
-
149
-
150
-
151
-
152
-
153
-
154
-
155
-
156
-
157
-
158
-
159
-
160
-
161
-
162
-
163
-
164
-
165
-
166
-
167
-
168
-
169
-
170
-
171
-
172
-
173
-
174
-
175
-
176
-
177
-
178
-
179
-
180
-
181
-
182
-
183
-
184
-
185
-
186
-
187
-
188
-
189
-
190
-
191
-
192
-
193
-
194
-
195
-
196
-
197
-
198
-
199
-
200
-
201
-
202
-
203
-
204
-
205
-
206
-
207
 |
 |

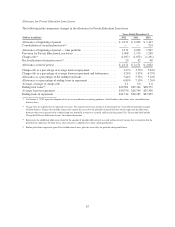
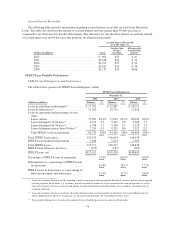
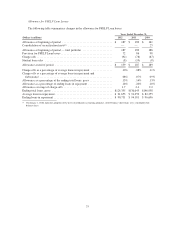
securitizing these loans to term through securitization trusts. However, existing FFELP ABCP and FHLB-DM
Facility capacities, as well as additional capital markets funding sources may be needed to complete our
objectives on a timely basis.
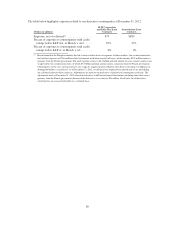
Since December 31, 2010, we have refinanced approximately $9.4 billion in principal amount of our FFELP
Loans previously financed through the ED Conduit Program, most being funded to term through the use of
securitization trusts. As of December 31, 2012, we have $9.5 billion in principal amount of FFELP Loans
remaining in the ED Conduit Program. If we cannot obtain sufficient cost-effective funding to finance any or all
of the FFELP Loans remaining in the ED Conduit Program on or before the ED Maturity Date, any remaining
FFELP Loans still in the program must be put to ED at 97 percent of their principal balance which results in us
forfeiting three percent of the principal amount of those loans. In addition, we will also no longer collect future
servicing revenues or interest income on any loans put to ED.
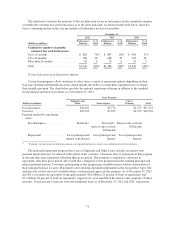
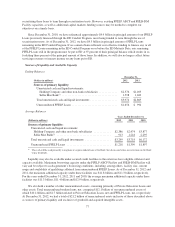
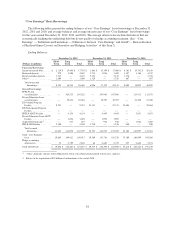
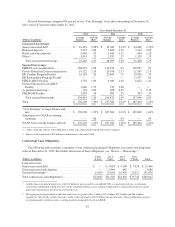
Sources of Liquidity and Available Capacity
Ending Balances
December 31,
(Dollars in millions) 2012 2011
Sources of primary liquidity:
Unrestricted cash and liquid investments:
Holding Company and other non-bank subsidiaries ............. $2,376 $1,403
Sallie Mae Bank(1) ....................................... 1,598 1,462
Total unrestricted cash and liquid investments ................... $3,974 $2,865
Unencumbered FFELP Loans ................................ $1,656 $ 994
Average Balances
Years Ended December 31,
(Dollars in millions) 2012 2011 2010
Sources of primary liquidity:
Unrestricted cash and liquid investments:
Holding Company and other non-bank subsidiaries ............ $2,386 $2,474 $3,877
Sallie Mae Bank(1) ...................................... 913 1,244 2,295
Total unrestricted cash and liquid investments .................. $3,299 $3,718 $6,172
Unencumbered FFELP Loans ............................... $1,218 $1,399 $1,897
(1) This cash will be used primarily to originate or acquire student loans at the Bank. See discussion below on restrictions on the Bank
to pay dividends.
Liquidity may also be available under secured credit facilities to the extent we have eligible collateral and
capacity available. Maximum borrowing capacity under the FFELP ABCP Facility and FHLB-DM Facility will
vary and be subject to each agreement’s borrowing conditions, including, among others, facility size, current
usage and availability of qualifying collateral from unencumbered FFELP Loans. As of December 31, 2012 and
2011, the maximum additional capacity under these facilities was $11.8 billion and $11.3 billion, respectively.
For the years ended December 31, 2012, 2011 and 2010, the average maximum additional capacity under these
facilities was $11.3 billion, $11.4 billion and $12.9 billion, respectively.
We also hold a number of other unencumbered assets, consisting primarily of Private Education Loans and
other assets. Total unencumbered student loans, net, comprised $12.1 billion of our unencumbered assets of
which $10.4 billion and $1.7 billion related to Private Education Loans, net and FFELP Loans, net, respectively.
At December 31, 2012, we had a total of $21.2 billion of unencumbered assets inclusive of those described above
as sources of primary liquidity and exclusive of goodwill and acquired intangible assets.
77