Sallie Mae 2012 Annual Report Download - page 194
Download and view the complete annual report
Please find page 194 of the 2012 Sallie Mae annual report below. You can navigate through the pages in the report by either clicking on the pages listed below, or by using the keyword search tool below to find specific information within the annual report.-
 1
1 -
2
-
3
-
4
-
5
-
6
-
7
-
8
-
9
-
10
-
11
-
12
-
13
-
14
-
15
-
16
-
17
-
18
-
19
-
20
-
21
-
22
-
23
-
24
-
25
-
26
-
27
-
28
-
29
-
30
-
31
-
32
-
33
-
34
-
35
-
36
-
37
-
38
-
39
-
40
-
41
-
42
-
43
-
44
-
45
-
46
-
47
-
48
-
49
-
50
-
51
-
52
-
53
-
54
-
55
-
56
-
57
-
58
-
59
-
60
-
61
-
62
-
63
-
64
-
65
-
66
-
67
-
68
-
69
-
70
-
71
-
72
-
73
-
74
-
75
-
76
-
77
-
78
-
79
-
80
-
81
-
82
-
83
-
84
-
85
-
86
-
87
-
88
-
89
-
90
-
91
-
92
-
93
-
94
-
95
-
96
-
97
-
98
-
99
-
100
-
101
-
102
-
103
-
104
-
105
-
106
-
107
-
108
-
109
-
110
-
111
-
112
-
113
-
114
-
115
-
116
-
117
-
118
-
119
-
120
-
121
-
122
-
123
-
124
-
125
-
126
-
127
-
128
-
129
-
130
-
131
-
132
-
133
-
134
-
135
-
136
-
137
-
138
-
139
-
140
-
141
-
142
-
143
-
144
-
145
-
146
-
147
-
148
-
149
-
150
-
151
-
152
-
153
-
154
-
155
-
156
-
157
-
158
-
159
-
160
-
161
-
162
-
163
-
164
-
165
-
166
-
167
-
168
-
169
-
170
-
171
-
172
-
173
-
174
-
175
-
176
-
177
-
178
-
179
-
180
-
181
-
182
-
183
-
 184
184 -
 185
185 -
 186
186 -
 187
187 -
 188
188 -
 189
189 -
 190
190 -
 191
191 -
 192
192 -
 193
193 -
 194
194 -
 195
195 -
 196
196 -
 197
197 -
 198
198 -
 199
199 -
 200
200 -
 201
201 -
 202
202 -
 203
203 -
 204
204 -
205
-
206
-
207
 |
 |

SLM CORPORATION
NOTES TO CONSOLIDATED FINANCIAL STATEMENTS (Continued)
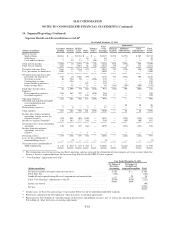
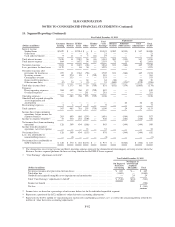
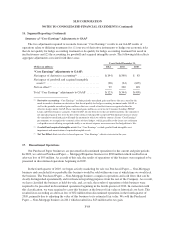
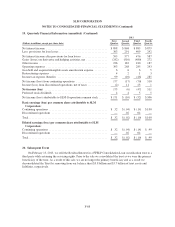
16. Segment Reporting (Continued)
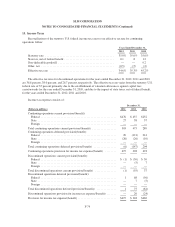
Summary of “Core Earnings” Adjustments to GAAP
The two adjustments required to reconcile from our “Core Earnings” results to our GAAP results of
operations relate to differing treatments for: (1) our use of derivative instruments to hedge our economic risks
that do not qualify for hedge accounting treatment or do qualify for hedge accounting treatment but result in
ineffectiveness and (2) the accounting for goodwill and acquired intangible assets. The following table reflects
aggregate adjustments associated with these areas.
Years Ended December 31,
(Dollars in millions) 2012 2011 2010
“Core Earnings” adjustments to GAAP:
Net impact of derivative accounting(1) ............... $(194) $(540) $ 83
Net impact of goodwill and acquired intangible
assets(2) ..................................... (28) (24) (699)
Net tax effect(3) ................................. 99 220 118
Total “Core Earnings” adjustments to GAAP ......... $(123) $(344) $(498)
(1) Derivative accounting: “Core Earnings” exclude periodic unrealized gains and losses that are caused by the
mark-to-market valuations on derivatives that do not qualify for hedge accounting treatment under GAAP as
well as the periodic unrealized gains and losses that are a result of ineffectiveness recognized related to
effective hedges under GAAP. These unrealized gains and losses occur in our Consumer Lending, FFELP
Loans and Other business segments. Under GAAP, for our derivatives that are held to maturity, the cumulative
net unrealized gain or loss over the life of the contract will equal $0 except for Floor Income Contracts where
the cumulative unrealized gain will equal the amount for which we sold the contract. In our “Core Earnings”
presentation, we recognize the economic effect of these hedges, which generally results in any net settlement
cash paid or received being recognized ratably as an interest expense or revenue over the hedged item’s life.
(2) Goodwill and acquired intangible assets: Our “Core Earnings” exclude goodwill and intangible asset
impairment and amortization of acquired intangible assets.
(3) Net Tax Effect: Such tax effect is based upon our “Core Earnings” effective tax rate for the year.
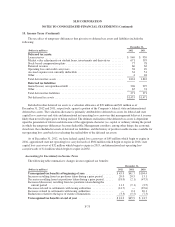
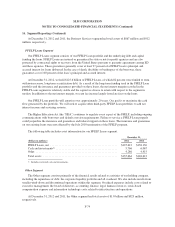
17. Discontinued Operations
Our Purchased Paper businesses are presented in discontinued operations for the current and prior periods.
In 2009, we sold our Purchased Paper — Mortgage/Properties business for $280 million which resulted in an
after-tax loss of $95 million. As a result of this sale, the results of operations of this business were required to be
presented in discontinued operations beginning in 2009.
In the fourth quarter of 2010, we began actively marketing for sale our Purchased Paper — Non-Mortgage
business and concluded it was probable this business would be sold within one year at which time we would exit
the business. The Purchased Paper — Non-Mortgage business comprises operations and cash flows that can be
clearly distinguished operationally and for financial reporting purposes from the rest of the Company. As a result,
we have classified the business as held-for-sale, and, as such, the results of operations of this business were
required to be presented in discontinued operations beginning in the fourth quarter of 2010. In connection with
this classification, we were required to carry this business at the lower of fair value or historical cost basis. This
resulted in us recording an after-tax loss of $52 million from discontinued operations in the fourth quarter of
2010, primarily due to adjusting the value of this business to its estimated fair value. We sold the Purchased
Paper — Non-Mortgage business in 2011 which resulted in a $23 million after-tax gain.
F-84