Sallie Mae 2012 Annual Report Download - page 39
Download and view the complete annual report
Please find page 39 of the 2012 Sallie Mae annual report below. You can navigate through the pages in the report by either clicking on the pages listed below, or by using the keyword search tool below to find specific information within the annual report.-
 1
1 -
2
-
3
-
4
-
5
-
6
-
7
-
8
-
9
-
10
-
11
-
12
-
13
-
14
-
15
-
16
-
17
-
18
-
19
-
20
-
21
-
22
-
23
-
24
-
25
-
26
-
27
-
28
-
 29
29 -
 30
30 -
 31
31 -
 32
32 -
 33
33 -
 34
34 -
 35
35 -
 36
36 -
 37
37 -
 38
38 -
 39
39 -
 40
40 -
 41
41 -
 42
42 -
 43
43 -
 44
44 -
 45
45 -
 46
46 -
 47
47 -
 48
48 -
 49
49 -
50
-
51
-
52
-
53
-
54
-
55
-
56
-
57
-
58
-
59
-
60
-
61
-
62
-
63
-
64
-
65
-
66
-
67
-
68
-
69
-
70
-
71
-
72
-
73
-
74
-
75
-
76
-
77
-
78
-
79
-
80
-
81
-
82
-
83
-
84
-
85
-
86
-
87
-
88
-
89
-
90
-
91
-
92
-
93
-
94
-
95
-
96
-
97
-
98
-
99
-
100
-
101
-
102
-
103
-
104
-
105
-
106
-
107
-
108
-
109
-
110
-
111
-
112
-
113
-
114
-
115
-
116
-
117
-
118
-
119
-
120
-
121
-
122
-
123
-
124
-
125
-
126
-
127
-
128
-
129
-
130
-
131
-
132
-
133
-
134
-
135
-
136
-
137
-
138
-
139
-
140
-
141
-
142
-
143
-
144
-
145
-
146
-
147
-
148
-
149
-
150
-
151
-
152
-
153
-
154
-
155
-
156
-
157
-
158
-
159
-
160
-
161
-
162
-
163
-
164
-
165
-
166
-
167
-
168
-
169
-
170
-
171
-
172
-
173
-
174
-
175
-
176
-
177
-
178
-
179
-
180
-
181
-
182
-
183
-
184
-
185
-
186
-
187
-
188
-
189
-
190
-
191
-
192
-
193
-
194
-
195
-
196
-
197
-
198
-
199
-
200
-
201
-
202
-
203
-
204
-
205
-
206
-
207
 |
 |

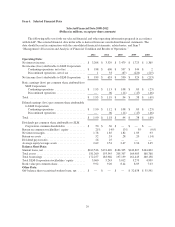
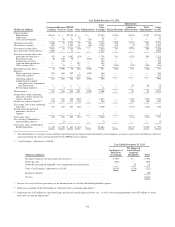
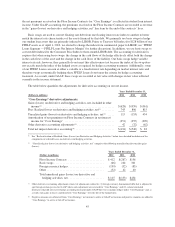
GAAP Consolidated Statements of Income
Increase (Decrease)
Years Ended December 31, 2012 vs. 2011 2011 vs. 2010
(Dollars in millions, except per share amounts) 2012 2011 2010 $ % $ %
Interest income
FFELP Loans .................................... $3,251 $3,461 $3,345 $(210) (6)% $ 116 3%
Private Education Loans ............................ 2,481 2,429 2,353 52 2 76 3
Other loans ...................................... 16 21 30 (5) (24) (9) (30)
Cash and investments .............................. 21 19 26 2 11 (7) (27)
Total interest income ................................. 5,769 5,930 5,754 (161) (3) 176 3
Total interest expense ................................ 2,561 2,401 2,275 160 7 126 6
Net interest income .................................. 3,208 3,529 3,479 (321) (9) 50 1
Less: provisions for loan losses ........................ 1,080 1,295 1,419 (215) (17) (124) (9)
Net interest income after provisions for loan losses ......... 2,128 2,234 2,060 (106) (5) 174 8
Other income (loss):
Gains (losses) on loans and investments, net ............ — (35) 325 35 (100) (360) (111)
Losses on derivative and hedging activities, net .......... (628) (959) (361) 331 (35) (598) 166
Servicing revenue ................................. 376 381 405 (5) (1) (24) (6)
Contingency revenue ............................... 356 333 330 23 7 3 1
Gains on debt repurchases ........................... 145 38 317 107 282 (279) (88)
Other income ..................................... 92 68 6 24 35 62 1,033
Total other income (loss) ............................. 341 (174) 1,022 515 (296) (1,196) (117)
Expenses:
Operating expenses ................................ 996 1,100 1,208 (104) (9) (108) (9)
Goodwill and acquired intangible assets impairment and
amortization expense ............................. 28 24 699 4 17 (675) (97)
Restructuring expenses ............................. 12 9 85 3 33 (76) (89)
Total expenses ...................................... 1,036 1,133 1,992 (97) (9) (859) (43)
Income from continuing operations, before income tax
expense ......................................... 1,433 927 1,090 506 55 (163) (15)
Income tax expense .................................. 497 328 493 169 52 (165) (33)
Net income from continuing operations .................. 936 599 597 337 56 2 —
Income (loss) from discontinued operations, net of tax
expense (benefit) .................................. 1 33 (67) (32) (97) 100 149
Net income ........................................ 937 632 530 305 48 102 19
Less: net loss attributable to noncontrolling interest ........ (2) (1) — (1) 100 (1) (100)
Net income attributable to SLM Corporation .............. 939 633 530 306 48 103 19
Preferred stock dividends ............................. 20 18 72 2 11 (54) (75)
Net income attributable to SLM Corporation common
stock ........................................... $ 919 $ 615 $ 458 $304 49% $ 157 34%
Basic earnings (loss) per common share attributable to
SLM Corporation:
Continuing operations .............................. $ 1.93 $ 1.13 $ 1.08 $ .80 71% $ .05 5%
Discontinued operations ............................ — .06 (.14) (.06) (100) .20 143
Total ............................................. $ 1.93 $ 1.19 $ .94 $ .74 62% $ .25 27%
Diluted earnings (loss) per common share attributable to
SLM Corporation:
Continuing operations .............................. $ 1.90 $ 1.12 $ 1.08 $ .78 71% $ .04 4%
Discontinued operations ............................ — .06 (.14) (.06) (100) .20 143
Total ............................................. $ 1.90 $ 1.18 $ .94 $ .72 61% $ .24 26%
Dividends per common share .......................... $ .50 $ .30 $ — $ .20 67% $ .30 100%
37