Sallie Mae 2012 Annual Report Download - page 62
Download and view the complete annual report
Please find page 62 of the 2012 Sallie Mae annual report below. You can navigate through the pages in the report by either clicking on the pages listed below, or by using the keyword search tool below to find specific information within the annual report.
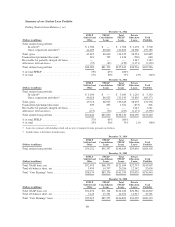
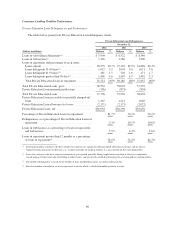
Summary of our Student Loan Portfolio
Ending Student Loan Balances, net
December 31, 2012
(Dollars in millions)
FFELP
Stafford and
Other
FFELP
Consolidation
Loans
Total
FFELP
Loans
Private
Education
Loans
Total
Portfolio
Total student loan portfolio:
In-school(1) ............................. $ 1,506 $ — $ 1,506 $ 2,194 $ 3,700
Grace, repayment and other(2) .............. 42,189 80,640 122,829 36,360 159,189
Total, gross ................................. 43,695 80,640 124,335 38,554 162,889
Unamortized premium/(discount) ............... 691 745 1,436 (796) 640
Receivable for partially charged-off loans ......... — — — 1,347 1,347
Allowance for loan losses ..................... (97) (62) (159) (2,171) (2,330)
Total student loan portfolio .................... $44,289 $81,323 $125,612 $36,934 $162,546
% of total FFELP ............................ 35% 65% 100%
% of total .................................. 27% 50% 77% 23% 100%
December 31, 2011
(Dollars in millions)
FFELP
Stafford and
Other
FFELP
Consolidation
Loans
Total
FFELP
Loans
Private
Education
Loans
Total
Portfolio
Total student loan portfolio:
In-school(1) ............................. $ 3,100 $ — $ 3,100 $ 2,263 $ 5,363
Grace, repayment and other(2) .............. 46,618 86,925 133,543 35,830 169,373
Total, gross ................................. 49,718 86,925 136,643 38,093 174,736
Unamortized premium/(discount) ............... 839 835 1,674 (873) 801
Receivable for partially charged-off loans ......... — — — 1,241 1,241
Allowance for loan losses ..................... (117) (70) (187) (2,171) (2,358)
Total student loan portfolio .................... $50,440 $87,690 $138,130 $36,290 $174,420
% of total FFELP ............................ 37% 63% 100%
% of total .................................. 29% 50% 79% 21% 100%
(1) Loans for customers still attending school and are not yet required to make payments on the loan.
(2) Includes loans in deferment or forbearance.
December 31, 2010
(Dollars in millions)
FFELP
Stafford and
Other
FFELP
Consolidation
Loans
Total
FFELP
Loans
Private
Education
Loans
Total
Portfolio
Total student loan portfolio .................... $56,252 $92,397 $148,649 $35,656 $184,305
December 31, 2009
(Dollars in millions)
FFELP
Stafford and
Other
FFELP
Consolidation
Loans
Total
FFELP
Loans
Private
Education
Loans
Total
Portfolio
Total GAAP basis, net ........................ $52,675 $68,379 $121,054 $22,753 $143,807
Total off-balance sheet, net .................... 5,499 14,797 20,296 12,342 32,638
Total “Core Earnings” basis .................... $58,174 $83,176 $141,350 $35,095 $176,445
December 31, 2008
(Dollars in millions)
FFELP
Stafford and
Other
FFELP
Consolidation
Loans
Total
FFELP
Loans
Private
Education
Loans
Total
Portfolio
Total GAAP basis, net ........................ $52,476 $71,744 $124,220 $20,582 $144,802
Total off-balance sheet, net .................... 7,143 15,531 22,674 12,917 35,591
Total “Core Earnings” basis .................... $59,619 $87,275 $146,894 $33,499 $180,393
60


