Sallie Mae 2012 Annual Report Download - page 150
Download and view the complete annual report
Please find page 150 of the 2012 Sallie Mae annual report below. You can navigate through the pages in the report by either clicking on the pages listed below, or by using the keyword search tool below to find specific information within the annual report.
SLM CORPORATION
NOTES TO CONSOLIDATED FINANCIAL STATEMENTS (Continued)
5. Goodwill and Acquired Intangible Assets (Continued)
Goodwill Impairment Testing
In performing our annual goodwill impairment analysis as of October 1, 2012, we assessed relevant
qualitative factors to determine whether it is “more-likely-than-not” that the fair value of an individual reporting
unit is less than its carrying value. As part of our qualitative assessment, we considered the amount of excess fair
value over the carrying values of the FFELP Loans, Private Education Loans and Servicing reporting units as of
October 1, 2010 when we performed a step 1 goodwill impairment test and engaged an appraisal firm to estimate
the fair values of these reporting units. The fair value of each reporting unit at October 1, 2010 significantly
exceeded its carrying amount.
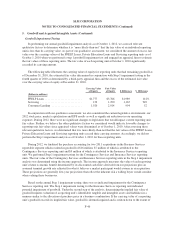
The following table illustrates the carrying value of equity for reporting units that had remaining goodwill as
of December 31, 2010, the estimated fair value determined in conjunction with Step 1 impairment testing in the
fourth quarter of 2010 as determined by a third-party appraisal firm and the excess of the estimated fair value
over the carrying value of equity at December 31, 2010.
Carrying Value
of Equity
Fair Value
of Equity $ Difference % Difference
(Dollars in millions)
FFELP Loans .......................... $1,777 $3,766 $1,989 112%
Servicing ............................. 123 1,290 1,167 949
Consumer Lending ..................... 1,920 2,914 994 52
In conjunction with our qualitative assessment, we also considered the current legislative environment, our
2012 stock price, market capitalization and EPS results as well as significant reductions in our operating
expenses. During 2012, there were no significant changes to legislation that would impact current reporting unit
fair values. Further, we believe the other qualitative factors we considered would indicate favorable changes to
reporting unit fair values since appraised values were determined as of October 1, 2010. After assessing these
relevant qualitative factors, we determined that it is more-likely-than-not that the fair values of the FFELP Loans,
Private Education Loans and Servicing reporting units exceed their carrying amounts. Accordingly, we did not
perform the Step 1 impairment analysis as of October 1, 2012 for these reporting units.
During 2012, we finalized the purchase accounting for two 2011 acquisitions in the Business Services
reportable segment which resulted in goodwill of $16 million, $7 million of which is attributed to the
Contingency Services reporting unit and $9 million of which is attributed to the Insurance Services reporting
unit. We performed Step 1 impairment testing for the Contingency Services and Insurance Services reporting
units. The fair value of the Contingency Services and Insurance Services reporting units in the Step 1 impairment
analysis was determined using the income approach. The income approach measures the value of each reporting
unit’s future economic benefit determined by its discounted cash flows derived from our projections plus an
assumed terminal growth rate adjusted for what it believes a market participant would assume in an acquisition.
These projections are generally five-year projections that reflect the inherent risk a willing buyer would consider
when valuing these businesses.
Based on the annual Step 1 impairment testing, there was no indicated impairment for the Contingency
Services reporting unit. The Step 1 impairment testing for the Insurance Services reporting unit indicated
potential impairment of goodwill. Under the second step of the analysis, determining the implied fair value of
goodwill requires valuation of a reporting unit’s identifiable tangible and intangible assets and liabilities in a
manner similar to the allocation of purchase price in a business combination. If the carrying value of a reporting
unit’s goodwill exceeds its implied fair value, goodwill is deemed impaired and is written down to the extent of
F-40


