Sallie Mae 2012 Annual Report Download - page 172
Download and view the complete annual report
Please find page 172 of the 2012 Sallie Mae annual report below. You can navigate through the pages in the report by either clicking on the pages listed below, or by using the keyword search tool below to find specific information within the annual report.-
 1
1 -
2
-
3
-
4
-
5
-
6
-
7
-
8
-
9
-
10
-
11
-
12
-
13
-
14
-
15
-
16
-
17
-
18
-
19
-
20
-
21
-
22
-
23
-
24
-
25
-
26
-
27
-
28
-
29
-
30
-
31
-
32
-
33
-
34
-
35
-
36
-
37
-
38
-
39
-
40
-
41
-
42
-
43
-
44
-
45
-
46
-
47
-
48
-
49
-
50
-
51
-
52
-
53
-
54
-
55
-
56
-
57
-
58
-
59
-
60
-
61
-
62
-
63
-
64
-
65
-
66
-
67
-
68
-
69
-
70
-
71
-
72
-
73
-
74
-
75
-
76
-
77
-
78
-
79
-
80
-
81
-
82
-
83
-
84
-
85
-
86
-
87
-
88
-
89
-
90
-
91
-
92
-
93
-
94
-
95
-
96
-
97
-
98
-
99
-
100
-
101
-
102
-
103
-
104
-
105
-
106
-
107
-
108
-
109
-
110
-
111
-
112
-
113
-
114
-
115
-
116
-
117
-
118
-
119
-
120
-
121
-
122
-
123
-
124
-
125
-
126
-
127
-
128
-
129
-
130
-
131
-
132
-
133
-
134
-
135
-
136
-
137
-
138
-
139
-
140
-
141
-
142
-
143
-
144
-
145
-
146
-
147
-
148
-
149
-
150
-
151
-
152
-
153
-
154
-
155
-
156
-
157
-
158
-
159
-
160
-
161
-
 162
162 -
 163
163 -
 164
164 -
 165
165 -
 166
166 -
 167
167 -
 168
168 -
 169
169 -
 170
170 -
 171
171 -
 172
172 -
 173
173 -
 174
174 -
 175
175 -
 176
176 -
 177
177 -
 178
178 -
 179
179 -
 180
180 -
 181
181 -
 182
182 -
183
-
184
-
185
-
186
-
187
-
188
-
189
-
190
-
191
-
192
-
193
-
194
-
195
-
196
-
197
-
198
-
199
-
200
-
201
-
202
-
203
-
204
-
205
-
206
-
207
 |
 |

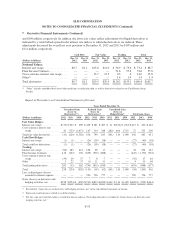
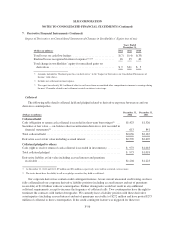
SLM CORPORATION
NOTES TO CONSOLIDATED FINANCIAL STATEMENTS (Continued)
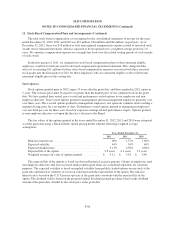
11. Stock-Based Compensation Plans and Arrangements (Continued)
The following table summarizes restricted stock activity for the year ended December 31, 2012.
Number of
Shares
Weighted
Average Grant
Date
Fair Value
Non-vested at December 31, 2011 ............................... 412,862 $12.07
Granted .................................................... 60,652 15.99
Vested(1) .................................................... (285,722) 13.24
Canceled ................................................... — —
Non-vested at December 31, 2012(2) .............................. 187,792 $11.55
(1) The total fair value of shares that vested during the years ended December 31, 2012, 2011 and 2010 was $4 million, $6 million and
$9 million, respectively.
(2) As of December 31, 2012, there was $.2 million of unrecognized compensation cost related to restricted stock net of estimated
forfeitures, which is expected to be recognized over a weighted average period of .8 years.
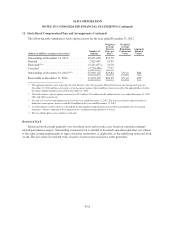
Restricted Stock Units and Performance Stock Units
Restricted stock units (“RSUs”) and performance stock units (“PSUs”) are equity awards granted to employees
that entitle the holder to shares of our common stock when the award vests. RSUs may be time-vested over three
years or vested at grant but subject to transfer restrictions, while PSUs vest based on corporate earnings-related
performance targets over a three-year period. Outstanding RSUs and PSUs are entitled to dividend equivalent units
that vest subject to the same vesting requirements or lapse of transfer restrictions, as applicable, as the underlying
award. The fair value of RSUs and PSUs is based on our stock price at the grant date.
The following table summarizes RSU and PSU activity for the year ended December 31, 2012.
Number of
RSUs/
PSUs
Weighted
Average Grant
Date
Fair Value
Outstanding at December 31, 2011 .............................. 2,730,690 $14.67
Granted .................................................... 2,746,912 16.00
Vested and converted to common stock(1) ......................... (920,332) 14.60
Canceled ................................................... (83,806) 15.41
Outstanding at December 31, 2012(2) ............................. 4,473,464 $15.49
(1) The total fair value of RSUs/PSUs that vested and converted to common stock during the years ended December 31, 2012, 2011
and 2010 was $13 million, $.4 million and $.4 million, respectively.
(2) As of December 31, 2012, there was $14 million of unrecognized compensation cost related to RSUs/PSUs net of estimated
forfeitures, which is expected to be recognized over a weighted average period of 1.9 years.
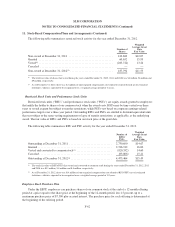
Employee Stock Purchase Plan
Under the ESPP, employees can purchase shares of our common stock at the end of a 12-month offering
period at a price equal to the share price at the beginning of the 12-month period, less 15 percent, up to a
maximum purchase price of $7,500 plus accrued interest. The purchase price for each offering is determined at
the beginning of the offering period.
F-62