Sallie Mae 2012 Annual Report Download - page 53
Download and view the complete annual report
Please find page 53 of the 2012 Sallie Mae annual report below. You can navigate through the pages in the report by either clicking on the pages listed below, or by using the keyword search tool below to find specific information within the annual report.-
 1
1 -
2
-
3
-
4
-
5
-
6
-
7
-
8
-
9
-
10
-
11
-
12
-
13
-
14
-
15
-
16
-
17
-
18
-
19
-
20
-
21
-
22
-
23
-
24
-
25
-
26
-
27
-
28
-
29
-
30
-
31
-
32
-
33
-
34
-
35
-
36
-
37
-
38
-
39
-
40
-
41
-
42
-
 43
43 -
 44
44 -
 45
45 -
 46
46 -
 47
47 -
 48
48 -
 49
49 -
 50
50 -
 51
51 -
 52
52 -
 53
53 -
 54
54 -
 55
55 -
 56
56 -
 57
57 -
 58
58 -
 59
59 -
 60
60 -
 61
61 -
 62
62 -
 63
63 -
64
-
65
-
66
-
67
-
68
-
69
-
70
-
71
-
72
-
73
-
74
-
75
-
76
-
77
-
78
-
79
-
80
-
81
-
82
-
83
-
84
-
85
-
86
-
87
-
88
-
89
-
90
-
91
-
92
-
93
-
94
-
95
-
96
-
97
-
98
-
99
-
100
-
101
-
102
-
103
-
104
-
105
-
106
-
107
-
108
-
109
-
110
-
111
-
112
-
113
-
114
-
115
-
116
-
117
-
118
-
119
-
120
-
121
-
122
-
123
-
124
-
125
-
126
-
127
-
128
-
129
-
130
-
131
-
132
-
133
-
134
-
135
-
136
-
137
-
138
-
139
-
140
-
141
-
142
-
143
-
144
-
145
-
146
-
147
-
148
-
149
-
150
-
151
-
152
-
153
-
154
-
155
-
156
-
157
-
158
-
159
-
160
-
161
-
162
-
163
-
164
-
165
-
166
-
167
-
168
-
169
-
170
-
171
-
172
-
173
-
174
-
175
-
176
-
177
-
178
-
179
-
180
-
181
-
182
-
183
-
184
-
185
-
186
-
187
-
188
-
189
-
190
-
191
-
192
-
193
-
194
-
195
-
196
-
197
-
198
-
199
-
200
-
201
-
202
-
203
-
204
-
205
-
206
-
207
 |
 |

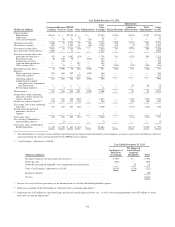
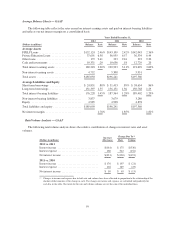
Business Services Segment
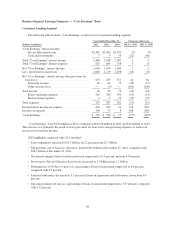
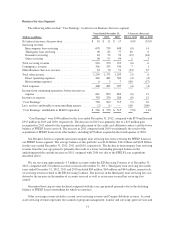
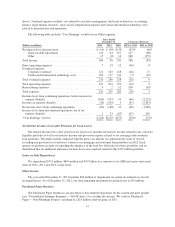
The following tables include “Core Earnings” results for our Business Services segment.
Years Ended December 31, % Increase (Decrease)
(Dollars in millions) 2012 2011 2010 2012 vs. 2011 2011 vs. 2010
Net interest income after provision .................. $ 10 $ 11 $ 17 (9)% (35)%
Servicing revenue:
Intercompany loan servicing ..................... 670 739 648 (9) 14
Third-party loan servicing ....................... 98 82 77 20 6
Guarantor servicing ............................ 44 52 93 (15) (44)
Other servicing ................................ 98 97 94 1 3
Total servicing revenue ........................... 910 970 912 (6) 6
Contingency revenue ............................. 356 333 330 7 1
Other Business Services revenue .................... 33 70 51 (53) 37
Total other income ............................... 1,299 1,373 1,293 (5) 6
Direct operating expenses ....................... 462 482 500 (4) (4)
Restructuring expenses ..........................637100 (57)
Total expenses .................................. 468 485 507 (4) (4)
Income from continuing operations, before income tax
expense ...................................... 841 899 803 (6) 12
Income tax expense .............................. 303 330 288 (8) 15
“Core Earnings” ................................. 538 569 515 (5) 10
Less: net loss attributable to noncontrolling interest ..... (2) (1) — 100 (100)
“Core Earnings” attributable to SLM Corporation ...... $ 540 $ 570 $ 515 (5)% 11%
“Core Earnings” were $540 million for the year ended December 31, 2012, compared with $570 million and
$515 million in 2011 and 2010, respectively. The decrease in 2012 was primarily due to a $25 million gain
recognized in 2011 related to the termination and replacement of the credit card affiliation contract and the lower
balance of FFELP Loans serviced. The increase in 2011 compared with 2010 was primarily the result of the
acquisition of FFELP Loans from other lenders, including $25 billion acquired in the fourth quarter of 2010.
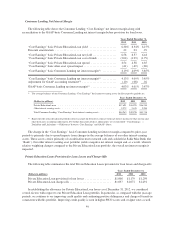
Our Business Services segment earns intercompany loan servicing fees from servicing the FFELP Loans in
our FFELP Loans segment. The average balance of this portfolio was $134 billion, $141 billion and $128 billion
for the years ended December 31, 2012, 2011 and 2010, respectively. The decline in intercompany loan servicing
revenue from the year-ago period is primarily the result of a lower outstanding principal balance in the
underlying portfolio and the increase in 2011 compared with 2010 was due to the FFELP Loan acquisitions
described above.
We are servicing approximately 4.3 million accounts under the ED Servicing Contract as of December 31,
2012, compared with 3.6 million accounts serviced at December 31, 2011. Third-party loan servicing fees in the
years ended December 31, 2012, 2011 and 2010 included $84 million, $63 million and $44 million, respectively,
of servicing revenue related to the ED Servicing Contract. The increase in the third-party loan servicing fees was
driven by the increase in the number of accounts serviced as well as an increase in ancillary servicing fees
earned.
Guarantor Servicing revenue declined compared with the year-ago periods primarily due to the declining
balance of FFELP Loans outstanding for which we earn fees.
Other servicing revenue includes account asset servicing revenue and Campus Solutions revenue. Account
asset servicing revenue represents fees earned on program management, transfer and servicing agent services and
51