Sallie Mae 2012 Annual Report Download - page 72
Download and view the complete annual report
Please find page 72 of the 2012 Sallie Mae annual report below. You can navigate through the pages in the report by either clicking on the pages listed below, or by using the keyword search tool below to find specific information within the annual report.-
 1
1 -
2
-
3
-
4
-
5
-
6
-
7
-
8
-
9
-
10
-
11
-
12
-
13
-
14
-
15
-
16
-
17
-
18
-
19
-
20
-
21
-
22
-
23
-
24
-
25
-
26
-
27
-
28
-
29
-
30
-
31
-
32
-
33
-
34
-
35
-
36
-
37
-
38
-
39
-
40
-
41
-
42
-
43
-
44
-
45
-
46
-
47
-
48
-
49
-
50
-
51
-
52
-
53
-
54
-
55
-
56
-
57
-
58
-
59
-
60
-
61
-
 62
62 -
 63
63 -
 64
64 -
 65
65 -
 66
66 -
 67
67 -
 68
68 -
 69
69 -
 70
70 -
 71
71 -
 72
72 -
 73
73 -
 74
74 -
 75
75 -
 76
76 -
 77
77 -
 78
78 -
 79
79 -
 80
80 -
 81
81 -
 82
82 -
83
-
84
-
85
-
86
-
87
-
88
-
89
-
90
-
91
-
92
-
93
-
94
-
95
-
96
-
97
-
98
-
99
-
100
-
101
-
102
-
103
-
104
-
105
-
106
-
107
-
108
-
109
-
110
-
111
-
112
-
113
-
114
-
115
-
116
-
117
-
118
-
119
-
120
-
121
-
122
-
123
-
124
-
125
-
126
-
127
-
128
-
129
-
130
-
131
-
132
-
133
-
134
-
135
-
136
-
137
-
138
-
139
-
140
-
141
-
142
-
143
-
144
-
145
-
146
-
147
-
148
-
149
-
150
-
151
-
152
-
153
-
154
-
155
-
156
-
157
-
158
-
159
-
160
-
161
-
162
-
163
-
164
-
165
-
166
-
167
-
168
-
169
-
170
-
171
-
172
-
173
-
174
-
175
-
176
-
177
-
178
-
179
-
180
-
181
-
182
-
183
-
184
-
185
-
186
-
187
-
188
-
189
-
190
-
191
-
192
-
193
-
194
-
195
-
196
-
197
-
198
-
199
-
200
-
201
-
202
-
203
-
204
-
205
-
206
-
207
 |
 |

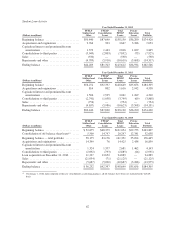
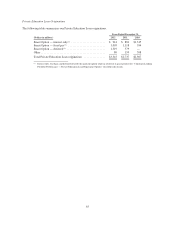
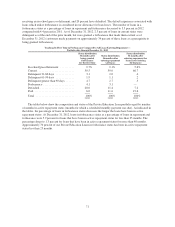
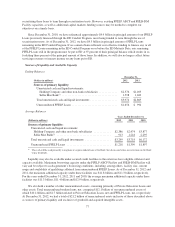
The following table summarizes the activity in the receivable for partially charged-off loans.
Years Ended
December 31,
(Dollars in millions) 2012 2011 2010
Receivable at beginning of period ...................... $1,241 $1,040 $ 499
Expected future recoveries of current period defaults(1) ..... 351 391 459
Recoveries(2) ....................................... (189) (155) (104)
Charge-offs(3) ...................................... (56) (35) (43)
Consolidation of securitization trusts(4) .................. — — 229
Receivable at end of period ........................... 1,347 1,241 1,040
Allowance for estimated recovery shortfalls(5) ............. (198) (148) —
Net receivable at end of period ........................ $1,149 $1,093 $1,040
(1) Represents the difference between the defaulted loan balance and our estimate of the amount to be collected in the future.
(2) Current period cash collections.
(3) Represents the current period recovery shortfall — the difference between what was expected to be collected and what was
actually collected. These amounts are included in total charge-offs as reported in the “Allowance for Private Education Loan
Losses” table.
(4) On January 1, 2010, upon the adoption of the new consolidation accounting guidance, all off-balance loans were
consolidated on-balance sheet.
(5) The allowance for estimated recovery shortfalls of the receivable for partially charged-off Private Education Loans is a
component of the $2.2 billion overall allowance for Private Education Loan losses as of December 31, 2012 and 2011.
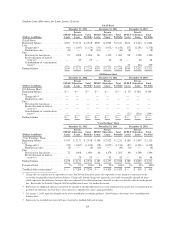
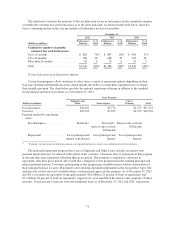
Use of Forbearance as a Private Education Loan Collection Tool
Forbearance involves granting the customer a temporary cessation of payments (or temporary acceptance of
smaller than scheduled payments) for a specified period of time. Using forbearance extends the original term of
the loan. Forbearance does not grant any reduction in the total repayment obligation (principal or interest). While
in forbearance status, interest continues to accrue and is capitalized to principal when the loan re-enters
repayment status. Our forbearance policies include limits on the number of forbearance months granted
consecutively and the total number of forbearance months granted over the life of the loan. In some instances, we
require good-faith payments before granting forbearance. Exceptions to forbearance policies are permitted when
such exceptions are judged to increase the likelihood of collection of the loan. Forbearance as a collection tool is
used most effectively when applied based on a customer’s unique situation, including historical information and
judgments. We leverage updated customer information and other decision support tools to best determine who
will be granted forbearance based on our expectations as to a customer’s ability and willingness to repay their
obligation. This strategy is aimed at mitigating the overall risk of the portfolio as well as encouraging cash
resolution of delinquent loans.
Forbearance may be granted to customers who are exiting their grace period to provide additional time to
obtain employment and income to support their obligations, or to current customers who are faced with a
hardship and request forbearance time to provide temporary payment relief. In these circumstances, a customer’s
loan is placed into a forbearance status in limited monthly increments and is reflected in the forbearance status at
month-end during this time. At the end of their granted forbearance period, the customer will enter repayment
status as current and is expected to begin making their scheduled monthly payments on a go-forward basis.
Forbearance may also be granted to customers who are delinquent in their payments. In these circumstances,
the forbearance cures the delinquency and the customer is returned to a current repayment status. In more limited
instances, delinquent customers will also be granted additional forbearance time.
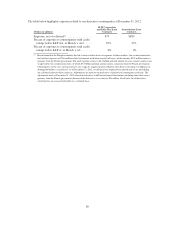
The table below reflects the historical effectiveness of using forbearance. Our experience has shown that
three years after being granted forbearance for the first time, 66 percent of the loans are current, paid in full, or
70