Sallie Mae 2012 Annual Report Download - page 82
Download and view the complete annual report
Please find page 82 of the 2012 Sallie Mae annual report below. You can navigate through the pages in the report by either clicking on the pages listed below, or by using the keyword search tool below to find specific information within the annual report.-
 1
1 -
2
-
3
-
4
-
5
-
6
-
7
-
8
-
9
-
10
-
11
-
12
-
13
-
14
-
15
-
16
-
17
-
18
-
19
-
20
-
21
-
22
-
23
-
24
-
25
-
26
-
27
-
28
-
29
-
30
-
31
-
32
-
33
-
34
-
35
-
36
-
37
-
38
-
39
-
40
-
41
-
42
-
43
-
44
-
45
-
46
-
47
-
48
-
49
-
50
-
51
-
52
-
53
-
54
-
55
-
56
-
57
-
58
-
59
-
60
-
61
-
62
-
63
-
64
-
65
-
66
-
67
-
68
-
69
-
70
-
71
-
 72
72 -
 73
73 -
 74
74 -
 75
75 -
 76
76 -
 77
77 -
 78
78 -
 79
79 -
 80
80 -
 81
81 -
 82
82 -
 83
83 -
 84
84 -
 85
85 -
 86
86 -
 87
87 -
 88
88 -
 89
89 -
 90
90 -
 91
91 -
 92
92 -
93
-
94
-
95
-
96
-
97
-
98
-
99
-
100
-
101
-
102
-
103
-
104
-
105
-
106
-
107
-
108
-
109
-
110
-
111
-
112
-
113
-
114
-
115
-
116
-
117
-
118
-
119
-
120
-
121
-
122
-
123
-
124
-
125
-
126
-
127
-
128
-
129
-
130
-
131
-
132
-
133
-
134
-
135
-
136
-
137
-
138
-
139
-
140
-
141
-
142
-
143
-
144
-
145
-
146
-
147
-
148
-
149
-
150
-
151
-
152
-
153
-
154
-
155
-
156
-
157
-
158
-
159
-
160
-
161
-
162
-
163
-
164
-
165
-
166
-
167
-
168
-
169
-
170
-
171
-
172
-
173
-
174
-
175
-
176
-
177
-
178
-
179
-
180
-
181
-
182
-
183
-
184
-
185
-
186
-
187
-
188
-
189
-
190
-
191
-
192
-
193
-
194
-
195
-
196
-
197
-
198
-
199
-
200
-
201
-
202
-
203
-
204
-
205
-
206
-
207
 |
 |

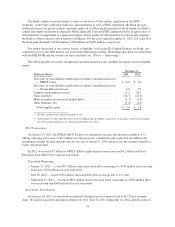
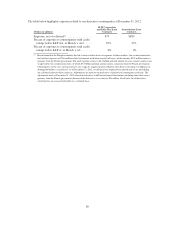
The table below highlights exposure related to our derivative counterparties at December 31, 2012.
(Dollars in millions)
SLM Corporation
and Sallie Mae Bank
Contracts
Securitization Trust
Contracts
Exposure, net of collateral(1) .................. $79 $889
Percent of exposure to counterparties with credit
ratings below S&P AA- or Moody’s Aa3 ...... 87% 37%
Percent of exposure to counterparties with credit
ratings below S&P A- or Moody’s A3 ........ 0% 0%
(1) Recent turmoil in the European markets has led to increased disclosure of exposure to those markets. Our securitization trusts
had total net exposure of $764 million related to financial institutions located in France; of this amount, $555 million carries a
guaranty from the French government. The total exposure relates to $6.4 billion notional amount of cross-currency interest rate
swaps held in our securitization trusts, of which $3.6 billion notional amount carries a guaranty from the French government.
Counterparties to the cross currency interest rate swaps are required to post collateral when their credit rating is withdrawn or
downgraded below a certain level. As of December 31, 2012, no collateral was required to be posted and we are not holding
any collateral related to these contracts. Adjustments are made to our derivative valuations for counterparty credit risk. The
adjustments made at December 31, 2012 related to derivatives with French financial institutions (including those that carry a
guaranty from the French government) decreased the derivative asset value by $94 million. Credit risks for all derivative
counterparties are assessed internally on a continual basis.
80