Sallie Mae 2012 Annual Report Download - page 43
Download and view the complete annual report
Please find page 43 of the 2012 Sallie Mae annual report below. You can navigate through the pages in the report by either clicking on the pages listed below, or by using the keyword search tool below to find specific information within the annual report.-
 1
1 -
2
-
3
-
4
-
5
-
6
-
7
-
8
-
9
-
10
-
11
-
12
-
13
-
14
-
15
-
16
-
17
-
18
-
19
-
20
-
21
-
22
-
23
-
24
-
25
-
26
-
27
-
28
-
29
-
30
-
31
-
32
-
 33
33 -
 34
34 -
 35
35 -
 36
36 -
 37
37 -
 38
38 -
 39
39 -
 40
40 -
 41
41 -
 42
42 -
 43
43 -
 44
44 -
 45
45 -
 46
46 -
 47
47 -
 48
48 -
 49
49 -
 50
50 -
 51
51 -
 52
52 -
 53
53 -
54
-
55
-
56
-
57
-
58
-
59
-
60
-
61
-
62
-
63
-
64
-
65
-
66
-
67
-
68
-
69
-
70
-
71
-
72
-
73
-
74
-
75
-
76
-
77
-
78
-
79
-
80
-
81
-
82
-
83
-
84
-
85
-
86
-
87
-
88
-
89
-
90
-
91
-
92
-
93
-
94
-
95
-
96
-
97
-
98
-
99
-
100
-
101
-
102
-
103
-
104
-
105
-
106
-
107
-
108
-
109
-
110
-
111
-
112
-
113
-
114
-
115
-
116
-
117
-
118
-
119
-
120
-
121
-
122
-
123
-
124
-
125
-
126
-
127
-
128
-
129
-
130
-
131
-
132
-
133
-
134
-
135
-
136
-
137
-
138
-
139
-
140
-
141
-
142
-
143
-
144
-
145
-
146
-
147
-
148
-
149
-
150
-
151
-
152
-
153
-
154
-
155
-
156
-
157
-
158
-
159
-
160
-
161
-
162
-
163
-
164
-
165
-
166
-
167
-
168
-
169
-
170
-
171
-
172
-
173
-
174
-
175
-
176
-
177
-
178
-
179
-
180
-
181
-
182
-
183
-
184
-
185
-
186
-
187
-
188
-
189
-
190
-
191
-
192
-
193
-
194
-
195
-
196
-
197
-
198
-
199
-
200
-
201
-
202
-
203
-
204
-
205
-
206
-
207
 |
 |

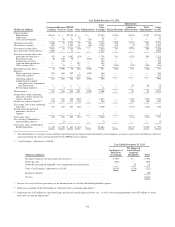
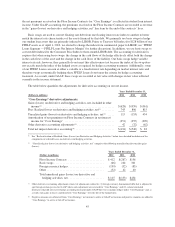
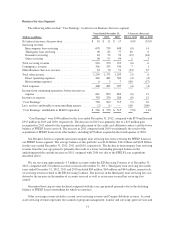
Year Ended December 31, 2012
(Dollars in millions)
Consumer
Lending
Business
Services
FFELP
Loans Other Eliminations(1)
Total
“Core
Earnings”
Adjustments
Total
GAAPReclassifications
Additions/
(Subtractions)
Total
Adjustments(2)
Interest income:
Student loans ............... $2,481 $ — $2,744 $ — $ — $5,225 $ 858 $(351) $ 507 $5,732
Other loans ................ — — — 16 — 16 — — — 16
Cash and investments ........ 7 10 11 3 (10) 21 — — — 21
Total interest income ........... 2,488 10 2,755 19 (10) 5,262 858 (351) 507 5,769
Total interest expense .......... 825 — 1,591 38 (10) 2,444 115 2(4) 117 2,561
Net interest income (loss) ....... 1,663 10 1,164 (19) — 2,818 743 (353) 390 3,208
Less: provisions for loan losses . . . 1,008 — 72 — — 1,080 — — — 1,080
Net interest income (loss) after
provisions for loan losses ..... 655 10 1,092 (19) — 1,738 743 (353) 390 2,128
Servicing revenue ........... 46 910 90 — (670) 376 — — — 376
Contingency revenue ......... — 356 — — — 356 — — — 356
Gains on debt repurchases ..... — — — 145 — 145 — — — 145
Other income (loss) .......... — 33 — 15 — 48 (743) 159(5) (584) (536)
Total other income (loss) ........ 46 1,299 90 160 (670) 925 (743) 159 (584) 341
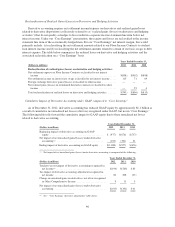
Expenses:
Direct operating expenses ..... 265 462 702 7 (670) 766 — — — 766
Overhead expenses .......... — — — 230 — 230 — — — 230
Operating expenses .......... 265 462 702 237 (670) 996 — — — 996
Goodwill and acquired
intangible assets impairment
and amortization .......... ———— — — — 28 28 28
Restructuring expenses ....... 2 6 — 4 — 12 — — — 12
Total expenses ................ 267 468 702 241 (670) 1,008 — 28 28 1,036
Income (loss) from continuing
operations, before income tax
expense (benefit) ............ 434 841 480 (100) — 1,655 — (222) (222) 1,433
Income tax expense (benefit)(3) . . . 156 303 173 (36) — 596 — (99) (99) 497
Net income (loss) from continuing
operations ................. 278 538 307 (64) — 1,059 — (123) (123) 936
Income from discontinued
operations, net of tax
expense ................... ———1— 1 — — — 1
Net income (loss) ............. 278 538 307 (63) — 1,060 — (123) (123) 937
Less: net loss attributable to
noncontrolling interest ........ — (2) — — — (2) — — — (2)
Net income (loss) attributable to
SLM Corporation ........... $ 278 $ 540 $ 307 $ (63) $ — $1,062 $ — $(123) $(123) $ 939
(1) The eliminations in servicing revenue and direct operating expense represent the elimination of intercompany servicing revenue where the Business Services
segment performs the loan servicing function for the FFELP Loans segment.
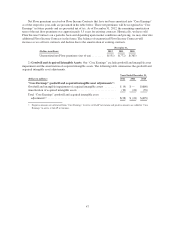
(2) “Core Earnings” adjustments to GAAP:
Year Ended December 31, 2012
(Dollars in millions)
Net Impact of
Derivative
Accounting
Net Impact of
Goodwill and
Acquired
Intangibles Total
Net interest income after provisions for loan losses ............................ $390 $— $390
Total other loss ......................................................... (584) — (584)
Goodwill and acquired intangible assets impairment and amortization ............. — 28 28
Total “Core Earnings” adjustments to GAAP ................................. $(194) $ (28) (222)
Income tax benefit ...................................................... (99)
Net loss ............................................................... $(123)
(3) Income taxes are based on a percentage of net income before tax for the individual reportable segment.
(4) Represents a portion of the $42 million of “other derivative accounting adjustments.”
(5) Represents the $115 million of “unrealized gains on derivative and hedging activities, net” as well as the remaining portion of the $42 million of “other
derivative accounting adjustments.”
41