Sallie Mae 2012 Annual Report Download - page 189
Download and view the complete annual report
Please find page 189 of the 2012 Sallie Mae annual report below. You can navigate through the pages in the report by either clicking on the pages listed below, or by using the keyword search tool below to find specific information within the annual report.-
 1
1 -
2
-
3
-
4
-
5
-
6
-
7
-
8
-
9
-
10
-
11
-
12
-
13
-
14
-
15
-
16
-
17
-
18
-
19
-
20
-
21
-
22
-
23
-
24
-
25
-
26
-
27
-
28
-
29
-
30
-
31
-
32
-
33
-
34
-
35
-
36
-
37
-
38
-
39
-
40
-
41
-
42
-
43
-
44
-
45
-
46
-
47
-
48
-
49
-
50
-
51
-
52
-
53
-
54
-
55
-
56
-
57
-
58
-
59
-
60
-
61
-
62
-
63
-
64
-
65
-
66
-
67
-
68
-
69
-
70
-
71
-
72
-
73
-
74
-
75
-
76
-
77
-
78
-
79
-
80
-
81
-
82
-
83
-
84
-
85
-
86
-
87
-
88
-
89
-
90
-
91
-
92
-
93
-
94
-
95
-
96
-
97
-
98
-
99
-
100
-
101
-
102
-
103
-
104
-
105
-
106
-
107
-
108
-
109
-
110
-
111
-
112
-
113
-
114
-
115
-
116
-
117
-
118
-
119
-
120
-
121
-
122
-
123
-
124
-
125
-
126
-
127
-
128
-
129
-
130
-
131
-
132
-
133
-
134
-
135
-
136
-
137
-
138
-
139
-
140
-
141
-
142
-
143
-
144
-
145
-
146
-
147
-
148
-
149
-
150
-
151
-
152
-
153
-
154
-
155
-
156
-
157
-
158
-
159
-
160
-
161
-
162
-
163
-
164
-
165
-
166
-
167
-
168
-
169
-
170
-
171
-
172
-
173
-
174
-
175
-
176
-
177
-
178
-
 179
179 -
 180
180 -
 181
181 -
 182
182 -
 183
183 -
 184
184 -
 185
185 -
 186
186 -
 187
187 -
 188
188 -
 189
189 -
 190
190 -
 191
191 -
 192
192 -
 193
193 -
 194
194 -
 195
195 -
 196
196 -
 197
197 -
 198
198 -
 199
199 -
200
-
201
-
202
-
203
-
204
-
205
-
206
-
207
 |
 |

SLM CORPORATION
NOTES TO CONSOLIDATED FINANCIAL STATEMENTS (Continued)
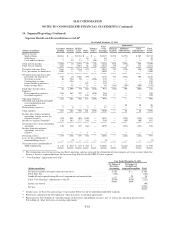
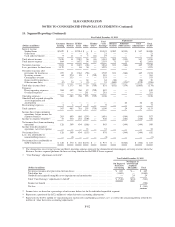
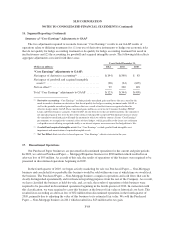
16. Segment Reporting (Continued)
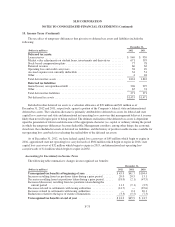
At December 31, 2012 and 2011, the Business Services segment had total assets of $867 million and $912
million, respectively.
FFELP Loans Segment
Our FFELP Loans segment consists of our FFELP Loan portfolio and the underlying debt and capital
funding the loans. FFELP Loans are insured or guaranteed by state or not-for-profit agencies and are also
protected by contractual rights to recovery from the United States pursuant to guaranty agreements among ED
and these agencies. These guarantees generally cover at least 97 percent of a FFELP Loan’s principal and
accrued interest for loans disbursed. In the case of death, disability or bankruptcy of the borrower, these
guarantees cover 100 percent of the loan’s principal and accrued interest.
At December 31, 2012, we held $125.6 billion of FFELP Loans, of which 82 percent were funded to term
with non-recourse, long-term securitization debt. As a result of the long-term funding used in the FFELP Loan
portfolio and the insurance and guarantees provided on these loans, the net interest margin recorded in the
FFELP Loans segment is relatively stable and the capital we choose to retain with respect to the segment is
modest. In addition to the net interest margin, we earn fee income largely from late fees on the loans.
Our FFELP Loan portfolio will amortize over approximately 20 years. Our goal is to maximize the cash
flow generated by the portfolio. We will seek to acquire other third-party FFELP Loan portfolios to add net
interest income and servicing revenue.
The Higher Education Act (the “HEA”) continues to regulate every aspect of the FFELP, including ongoing
communications with borrowers and default aversion requirements. Failure to service a FFELP Loan properly
could jeopardize the insurance and guarantees and federal support on these loans. The insurance and guarantees
on our existing loans were not affected by the July 2010 termination of the FFELP program.
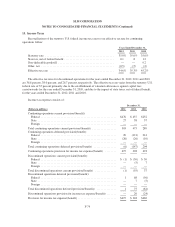
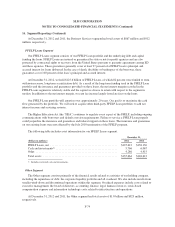
The following table includes asset information for our FFELP Loans segment.
December 31,
(Dollars in millions) 2012 2011
FFELP Loans, net ............................................... $125,612 $138,130
Cash and investments(1) ........................................... 5,766 6,067
Other ......................................................... 4,286 4,415
Total assets .................................................... $135,664 $148,612
(1) Includes restricted cash and investments.
Other Segment
The Other segment consists primarily of the financial results related to activities of our holding company,
including the repurchase of debt, the corporate liquidity portfolio and all overhead. We also include results from
smaller wind-down and discontinued operations within this segment. Overhead expenses include costs related to
executive management, the board of directors, accounting, finance, legal, human resources, stock-based
compensation expense and information technology costs related to infrastructure and operations.
At December 31, 2012 and 2011, the Other segment had total assets of $1.8 billion and $823 million,
respectively.
F-79