Sallie Mae 2012 Annual Report Download - page 61
Download and view the complete annual report
Please find page 61 of the 2012 Sallie Mae annual report below. You can navigate through the pages in the report by either clicking on the pages listed below, or by using the keyword search tool below to find specific information within the annual report.-
 1
1 -
2
-
3
-
4
-
5
-
6
-
7
-
8
-
9
-
10
-
11
-
12
-
13
-
14
-
15
-
16
-
17
-
18
-
19
-
20
-
21
-
22
-
23
-
24
-
25
-
26
-
27
-
28
-
29
-
30
-
31
-
32
-
33
-
34
-
35
-
36
-
37
-
38
-
39
-
40
-
41
-
42
-
43
-
44
-
45
-
46
-
47
-
48
-
49
-
50
-
 51
51 -
 52
52 -
 53
53 -
 54
54 -
 55
55 -
 56
56 -
 57
57 -
 58
58 -
 59
59 -
 60
60 -
 61
61 -
 62
62 -
 63
63 -
 64
64 -
 65
65 -
 66
66 -
 67
67 -
 68
68 -
 69
69 -
 70
70 -
 71
71 -
72
-
73
-
74
-
75
-
76
-
77
-
78
-
79
-
80
-
81
-
82
-
83
-
84
-
85
-
86
-
87
-
88
-
89
-
90
-
91
-
92
-
93
-
94
-
95
-
96
-
97
-
98
-
99
-
100
-
101
-
102
-
103
-
104
-
105
-
106
-
107
-
108
-
109
-
110
-
111
-
112
-
113
-
114
-
115
-
116
-
117
-
118
-
119
-
120
-
121
-
122
-
123
-
124
-
125
-
126
-
127
-
128
-
129
-
130
-
131
-
132
-
133
-
134
-
135
-
136
-
137
-
138
-
139
-
140
-
141
-
142
-
143
-
144
-
145
-
146
-
147
-
148
-
149
-
150
-
151
-
152
-
153
-
154
-
155
-
156
-
157
-
158
-
159
-
160
-
161
-
162
-
163
-
164
-
165
-
166
-
167
-
168
-
169
-
170
-
171
-
172
-
173
-
174
-
175
-
176
-
177
-
178
-
179
-
180
-
181
-
182
-
183
-
184
-
185
-
186
-
187
-
188
-
189
-
190
-
191
-
192
-
193
-
194
-
195
-
196
-
197
-
198
-
199
-
200
-
201
-
202
-
203
-
204
-
205
-
206
-
207
 |
 |

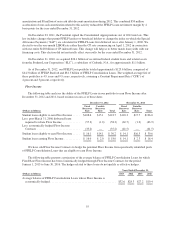
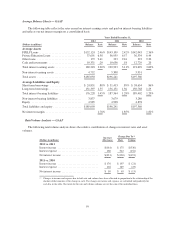
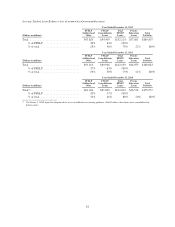
Average Balance Sheets — GAAP
The following table reflects the rates earned on interest-earning assets and paid on interest-bearing liabilities
and reflects our net interest margin on a consolidated basis.
Years Ended December 31,
2012 2011 2010
(Dollars in millions) Balance Rate Balance Rate Balance Rate
Average Assets
FFELP Loans .............................. $132,124 2.46% $143,109 2.42% $142,043 2.36%
Private Education Loans ..................... 37,691 6.58 36,955 6.57 36,534 6.44
Other loans ............................... 172 9.41 233 9.16 323 9.20
Cash and investments ....................... 10,331 .20 10,636 .18 12,729 .20
Total interest-earning assets .................. 180,318 3.20% 190,933 3.11% 191,629 3.00%
Non-interest-earning assets ................... 4,732 5,308 5,931
Total assets ............................... $185,050 $196,241 $197,560
Average Liabilities and Equity
Short-term borrowings ...................... $ 24,831 .88% $ 31,413 .89% $ 38,634 .86%
Long-term borrowings ....................... 151,397 1.55 156,151 1.36 150,768 1.29
Total interest-bearing liabilities ............... 176,228 1.45% 187,564 1.28% 189,402 1.20%
Non-interest-bearing liabilities ................ 3,837 3,679 3,280
Equity ................................... 4,985 4,998 4,878
Total liabilities and equity .................... $185,050 $196,241 $197,560
Net interest margin ......................... 1.78% 1.85% 1.82%
Rate/Volume Analysis — GAAP
The following rate/volume analysis shows the relative contribution of changes in interest rates and asset
volumes.
Increase
(Decrease)
Change Due To(1)
(Dollars in millions) Rate Volume
2012 vs. 2011
Interest income .............................. $(161) $ 175 $(336)
Interest expense .............................. 160 312 (152)
Net interest income ........................... $(321) $(130) $(191)
2011 vs. 2010
Interest income .............................. $176 $197 $ (21)
Interest expense .............................. 126 149 (23)
Net interest income ........................... $ 50 $ 63 $ (13)
(1) Changes in income and expense due to both rate and volume have been allocated in proportion to the relationship of the
absolute dollar amounts of the change in each. The changes in income and expense are calculated independently for
each line in the table. The totals for the rate and volume columns are not the sum of the individual lines.
59