Sallie Mae 2012 Annual Report Download - page 54
Download and view the complete annual report
Please find page 54 of the 2012 Sallie Mae annual report below. You can navigate through the pages in the report by either clicking on the pages listed below, or by using the keyword search tool below to find specific information within the annual report.-
 1
1 -
2
-
3
-
4
-
5
-
6
-
7
-
8
-
9
-
10
-
11
-
12
-
13
-
14
-
15
-
16
-
17
-
18
-
19
-
20
-
21
-
22
-
23
-
24
-
25
-
26
-
27
-
28
-
29
-
30
-
31
-
32
-
33
-
34
-
35
-
36
-
37
-
38
-
39
-
40
-
41
-
42
-
43
-
 44
44 -
 45
45 -
 46
46 -
 47
47 -
 48
48 -
 49
49 -
 50
50 -
 51
51 -
 52
52 -
 53
53 -
 54
54 -
 55
55 -
 56
56 -
 57
57 -
 58
58 -
 59
59 -
 60
60 -
 61
61 -
 62
62 -
 63
63 -
 64
64 -
65
-
66
-
67
-
68
-
69
-
70
-
71
-
72
-
73
-
74
-
75
-
76
-
77
-
78
-
79
-
80
-
81
-
82
-
83
-
84
-
85
-
86
-
87
-
88
-
89
-
90
-
91
-
92
-
93
-
94
-
95
-
96
-
97
-
98
-
99
-
100
-
101
-
102
-
103
-
104
-
105
-
106
-
107
-
108
-
109
-
110
-
111
-
112
-
113
-
114
-
115
-
116
-
117
-
118
-
119
-
120
-
121
-
122
-
123
-
124
-
125
-
126
-
127
-
128
-
129
-
130
-
131
-
132
-
133
-
134
-
135
-
136
-
137
-
138
-
139
-
140
-
141
-
142
-
143
-
144
-
145
-
146
-
147
-
148
-
149
-
150
-
151
-
152
-
153
-
154
-
155
-
156
-
157
-
158
-
159
-
160
-
161
-
162
-
163
-
164
-
165
-
166
-
167
-
168
-
169
-
170
-
171
-
172
-
173
-
174
-
175
-
176
-
177
-
178
-
179
-
180
-
181
-
182
-
183
-
184
-
185
-
186
-
187
-
188
-
189
-
190
-
191
-
192
-
193
-
194
-
195
-
196
-
197
-
198
-
199
-
200
-
201
-
202
-
203
-
204
-
205
-
206
-
207
 |
 |

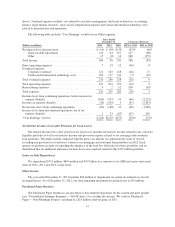
administration services for our various 529 college-savings plans. Assets under administration in our 529
college-savings plans totaled $44.7 billion as of December 31, 2012, a 19 percent increase from 2011. Campus
Solutions revenue is earned from our Campus Solutions business whose services include comprehensive
transaction processing solutions and associated technology that we provide to college financial aid offices and
students to streamline the financial aid process.
Our contingency revenue consists of fees we receive for the collections of delinquent debt on behalf of
clients performed on a contingent basis. Contingency revenue increased $23 million compared with 2011 as a
result of the higher volume of collections.
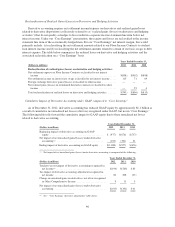
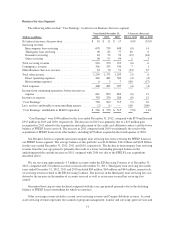
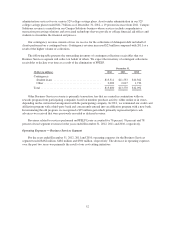
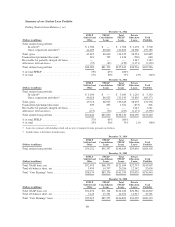
The following table presents the outstanding inventory of contingent collections receivables that our
Business Services segment will collect on behalf of others. We expect the inventory of contingent collections
receivables to decline over time as a result of the elimination of FFELP.
December 31,
(Dollars in millions) 2012 2011 2010
Contingency:
Student loans ................................. $13,511 $11,553 $10,362
Other ........................................ 2,089 2,017 1,730
Total .......................................... $15,600 $13,570 $12,092
Other Business Services revenue is primarily transaction fees that are earned in conjunction with our
rewards program from participating companies based on member purchase activity, either online or in stores,
depending on the contractual arrangement with the participating company. In 2011, we terminated our credit card
affiliation program with a third-party bank and concurrently entered into an affiliation program with a new bank.
In terminating the old program, we recognized a $25 million gain which primarily represented prior cash
advances we received that were previously recorded as deferred revenue.
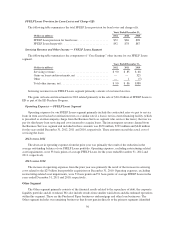
Revenues related to services performed on FFELP Loans accounted for 76 percent, 76 percent and 78
percent of total segment revenues for the years ended December 31, 2012, 2011 and 2010, respectively.
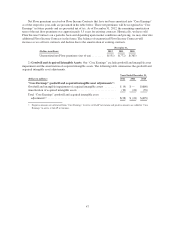
Operating Expenses — Business Services Segment
For the years ended December 31, 2012, 2011 and 2010, operating expenses for the Business Services
segment totaled $462 million, $482 million and $500 million, respectively. The decrease in operating expenses
over the past two years was primarily the result of our cost-cutting initiatives.
52