Sallie Mae 2012 Annual Report Download - page 56
Download and view the complete annual report
Please find page 56 of the 2012 Sallie Mae annual report below. You can navigate through the pages in the report by either clicking on the pages listed below, or by using the keyword search tool below to find specific information within the annual report.-
 1
1 -
2
-
3
-
4
-
5
-
6
-
7
-
8
-
9
-
10
-
11
-
12
-
13
-
14
-
15
-
16
-
17
-
18
-
19
-
20
-
21
-
22
-
23
-
24
-
25
-
26
-
27
-
28
-
29
-
30
-
31
-
32
-
33
-
34
-
35
-
36
-
37
-
38
-
39
-
40
-
41
-
42
-
43
-
44
-
45
-
 46
46 -
 47
47 -
 48
48 -
 49
49 -
 50
50 -
 51
51 -
 52
52 -
 53
53 -
 54
54 -
 55
55 -
 56
56 -
 57
57 -
 58
58 -
 59
59 -
 60
60 -
 61
61 -
 62
62 -
 63
63 -
 64
64 -
 65
65 -
 66
66 -
67
-
68
-
69
-
70
-
71
-
72
-
73
-
74
-
75
-
76
-
77
-
78
-
79
-
80
-
81
-
82
-
83
-
84
-
85
-
86
-
87
-
88
-
89
-
90
-
91
-
92
-
93
-
94
-
95
-
96
-
97
-
98
-
99
-
100
-
101
-
102
-
103
-
104
-
105
-
106
-
107
-
108
-
109
-
110
-
111
-
112
-
113
-
114
-
115
-
116
-
117
-
118
-
119
-
120
-
121
-
122
-
123
-
124
-
125
-
126
-
127
-
128
-
129
-
130
-
131
-
132
-
133
-
134
-
135
-
136
-
137
-
138
-
139
-
140
-
141
-
142
-
143
-
144
-
145
-
146
-
147
-
148
-
149
-
150
-
151
-
152
-
153
-
154
-
155
-
156
-
157
-
158
-
159
-
160
-
161
-
162
-
163
-
164
-
165
-
166
-
167
-
168
-
169
-
170
-
171
-
172
-
173
-
174
-
175
-
176
-
177
-
178
-
179
-
180
-
181
-
182
-
183
-
184
-
185
-
186
-
187
-
188
-
189
-
190
-
191
-
192
-
193
-
194
-
195
-
196
-
197
-
198
-
199
-
200
-
201
-
202
-
203
-
204
-
205
-
206
-
207
 |
 |

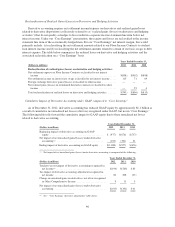
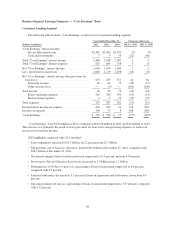
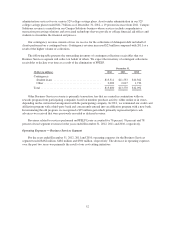
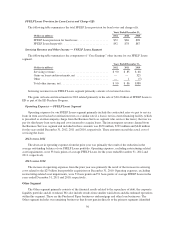
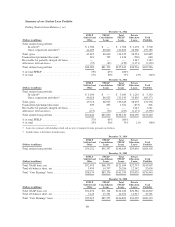
FFELP Loans Net Interest Margin
The following table shows the FFELP Loans “Core Earnings” net interest margin along with reconciliation
to the GAAP-basis FFELP Loans net interest margin.
Years Ended December 31,
2012 2011 2010
“Core Earnings” basis FFELP Loan yield ................ 2.66% 2.59% 2.57%
Hedged Floor Income ............................... .26 .25 .23
Unhedged Floor Income ............................. .11 .12 .02
Consolidation Loan Rebate Fees ....................... (.67) (.65) (.59)
Repayment Borrower Benefits ........................ (.13) (.12) (.10)
Premium amortization ............................... (.15) (.15) (.18)
“Core Earnings” basis FFELP Loan net yield ............. 2.08 2.04 1.95
“Core Earnings” basis FFELP Loan cost of funds ......... (1.13) (.98) (.93)
“Core Earnings” basis FFELP Loan spread .............. .95 1.06 1.02
“Core Earnings” basis FFELP other asset spread impact .... (.11) (.08) (.09)
“Core Earnings” basis FFELP Loans net interest margin(1) . . .84% .98% .93%
“Core Earnings” basis FFELP Loans net interest margin(1) . . .84% .98% .93%
Adjustment for GAAP accounting treatment(2) ............ .31 .34 .33
GAAP-basis FFELP Loans net interest margin ........... 1.15% 1.32% 1.26%
(1) The average balances of our FFELP “Core Earnings” basis interest-earning assets for the respective periods are:
Years Ended December 31,
2012 2011 2010
(Dollars in millions)
FFELP Loans ............................................. $132,124 $143,109 $142,043
Other interest-earning assets .................................. 6,619 5,194 5,562
Total FFELP “Core Earnings” basis interest-earning assets .......... $138,743 $148,303 $147,605
(2) Represents the reclassification of periodic interest accruals on derivative contracts from net interest income to other income
and other derivative accounting adjustments. For further discussion of these adjustments, see section titled “‘Core Earnings’
— Definition and Limitations — Differences between ‘Core Earnings’ and GAAP” above.
The decrease in the “Core Earnings” basis FFELP Loans net interest margin of 14 basis points for the year
ended December 31, 2012 compared with the year-ago period was primarily the result of funding costs related to
new unsecured and ABS debt issuances over the last year being higher than the funding costs of the debt that has
matured or has been repurchased during that same period. In addition, there were increased spread impacts from
increases in the average balance of our other interest-earning assets. These assets are primarily securitization trust
restricted cash. Our other interest-earning asset portfolio yields a negative net interest margin and as a result,
when its relative weighting increases, the overall net interest margin declines.
The increase in the “Core Earnings” basis FFELP Loans net interest margin of 5 basis points for 2011
compared with 2010 was primarily the result of an increase in Floor Income due to lower interest rates.
During the fourth-quarter 2011, the Administration announced SDCL. The initiative provided an incentive to
borrowers who have at least one student loan owned by ED and at least one held by a FFELP lender to consolidate
the FFELP lender’s loans into the Direct Loan Program by providing a 0.25 percentage point interest rate reduction
on the FFELP Loans that are eligible for consolidation. The program was available from January 17, 2012 through
June 30, 2012. As a result of the SDCL initiative, borrowers consolidated approximately $5.2 billion of our FFELP
Loans to ED. The consolidation of these loans resulted in the acceleration of $42 million of non-cash loan premium
54