Sallie Mae 2012 Annual Report Download - page 83
Download and view the complete annual report
Please find page 83 of the 2012 Sallie Mae annual report below. You can navigate through the pages in the report by either clicking on the pages listed below, or by using the keyword search tool below to find specific information within the annual report.-
 1
1 -
2
-
3
-
4
-
5
-
6
-
7
-
8
-
9
-
10
-
11
-
12
-
13
-
14
-
15
-
16
-
17
-
18
-
19
-
20
-
21
-
22
-
23
-
24
-
25
-
26
-
27
-
28
-
29
-
30
-
31
-
32
-
33
-
34
-
35
-
36
-
37
-
38
-
39
-
40
-
41
-
42
-
43
-
44
-
45
-
46
-
47
-
48
-
49
-
50
-
51
-
52
-
53
-
54
-
55
-
56
-
57
-
58
-
59
-
60
-
61
-
62
-
63
-
64
-
65
-
66
-
67
-
68
-
69
-
70
-
71
-
72
-
 73
73 -
 74
74 -
 75
75 -
 76
76 -
 77
77 -
 78
78 -
 79
79 -
 80
80 -
 81
81 -
 82
82 -
 83
83 -
 84
84 -
 85
85 -
 86
86 -
 87
87 -
 88
88 -
 89
89 -
 90
90 -
 91
91 -
 92
92 -
 93
93 -
94
-
95
-
96
-
97
-
98
-
99
-
100
-
101
-
102
-
103
-
104
-
105
-
106
-
107
-
108
-
109
-
110
-
111
-
112
-
113
-
114
-
115
-
116
-
117
-
118
-
119
-
120
-
121
-
122
-
123
-
124
-
125
-
126
-
127
-
128
-
129
-
130
-
131
-
132
-
133
-
134
-
135
-
136
-
137
-
138
-
139
-
140
-
141
-
142
-
143
-
144
-
145
-
146
-
147
-
148
-
149
-
150
-
151
-
152
-
153
-
154
-
155
-
156
-
157
-
158
-
159
-
160
-
161
-
162
-
163
-
164
-
165
-
166
-
167
-
168
-
169
-
170
-
171
-
172
-
173
-
174
-
175
-
176
-
177
-
178
-
179
-
180
-
181
-
182
-
183
-
184
-
185
-
186
-
187
-
188
-
189
-
190
-
191
-
192
-
193
-
194
-
195
-
196
-
197
-
198
-
199
-
200
-
201
-
202
-
203
-
204
-
205
-
206
-
207
 |
 |

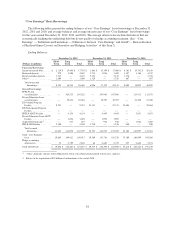
“Core Earnings” Basis Borrowings
The following tables present the ending balances of our “Core Earnings” basis borrowings at December 31,
2012, 2011 and 2010, and average balances and average interest rates of our “Core Earnings” basis borrowings
for the years ended December 31, 2012, 2011 and 2010. The average interest rates include derivatives that are
economically hedging the underlying debt but do not qualify for hedge accounting treatment. (See “‘Core
Earnings’ — Definition and Limitations — Differences between ‘Core Earnings’ and GAAP — Reclassification
of Realized Gains (Losses) on Derivative and Hedging Activities” of this Item 7).
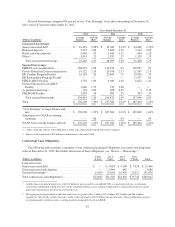
Ending Balances
December 31, 2012 December 31, 2011 December 31, 2010
(Dollars in millions)
Short
Term
Long
Term Total
Short
Term
Long
Term Total
Short
Term
Long
Term Total
Unsecured borrowings:
Senior unsecured debt ....... $ 2,319 $ 15,446 $ 17,765 $ 1,801 $ 15,199 $ 17,000 $ 4,361 $ 15,742 $ 20,103
Brokered deposits .......... 979 3,088 4,067 1,733 1,956 3,689 1,387 3,160 4,547
Retail and other deposits .... 3,247 — 3,247 2,123 — 2,123 1,370 — 1,370
Other(1) .................. 1,609 — 1,609 1,329 — 1,329 887 — 887
Total unsecured
borrowings ........... 8,154 18,534 26,688 6,986 17,155 24,141 8,005 18,902 26,907
Secured borrowings:
FFELP Loan
securitizations ........... — 105,525 105,525 — 107,905 107,905 — 113,671 113,671
Private Education Loan
securitizations ........... — 19,656 19,656 — 19,297 19,297 — 21,409 21,409
ED Conduit Program
Facility ................ 9,551 — 9,551 21,313 — 21,313 24,484 — 24,484
ED Participation Program
Facility ................ — — — — — — — — —
FFELP ABCP Facility ...... — 4,154 4,154 — 4,445 4,445 — 5,853 5,853
Private Education Loan ABCP
Facility ................ — 1,070 1,070 — 1,992 1,992 — — —
Acquisition financing(2) ..... — 673 673 — 916 916 — 1,064 1,064
FHLB-DM Facility ......... 2,100 — 2,100 1,210 — 1,210 900 — 900
Total secured
borrowings ........... 11,651 131,078 142,729 22,523 134,555 157,078 25,384 141,997 167,381
Total “Core Earnings”
basis .................. 19,805 149,612 169,417 29,509 151,710 181,219 33,389 160,899 194,288
Hedge accounting
adjustments ............. 51 2,789 2,840 64 2,683 2,747 227 2,644 2,871
Total GAAP basis .......... $ 19,856 $ 152,401 $ 172,257 $ 29,573 $ 154,393 $ 183,966 $ 33,616 $ 163,543 $ 197,159
(1) “Other” primarily consists of the obligation to return cash collateral held related to derivative exposure.
(2) Relates to the acquisition of $25 billion of student loans at the end of 2010.
81