Sallie Mae 2012 Annual Report Download - page 55
Download and view the complete annual report
Please find page 55 of the 2012 Sallie Mae annual report below. You can navigate through the pages in the report by either clicking on the pages listed below, or by using the keyword search tool below to find specific information within the annual report.-
 1
1 -
2
-
3
-
4
-
5
-
6
-
7
-
8
-
9
-
10
-
11
-
12
-
13
-
14
-
15
-
16
-
17
-
18
-
19
-
20
-
21
-
22
-
23
-
24
-
25
-
26
-
27
-
28
-
29
-
30
-
31
-
32
-
33
-
34
-
35
-
36
-
37
-
38
-
39
-
40
-
41
-
42
-
43
-
44
-
 45
45 -
 46
46 -
 47
47 -
 48
48 -
 49
49 -
 50
50 -
 51
51 -
 52
52 -
 53
53 -
 54
54 -
 55
55 -
 56
56 -
 57
57 -
 58
58 -
 59
59 -
 60
60 -
 61
61 -
 62
62 -
 63
63 -
 64
64 -
 65
65 -
66
-
67
-
68
-
69
-
70
-
71
-
72
-
73
-
74
-
75
-
76
-
77
-
78
-
79
-
80
-
81
-
82
-
83
-
84
-
85
-
86
-
87
-
88
-
89
-
90
-
91
-
92
-
93
-
94
-
95
-
96
-
97
-
98
-
99
-
100
-
101
-
102
-
103
-
104
-
105
-
106
-
107
-
108
-
109
-
110
-
111
-
112
-
113
-
114
-
115
-
116
-
117
-
118
-
119
-
120
-
121
-
122
-
123
-
124
-
125
-
126
-
127
-
128
-
129
-
130
-
131
-
132
-
133
-
134
-
135
-
136
-
137
-
138
-
139
-
140
-
141
-
142
-
143
-
144
-
145
-
146
-
147
-
148
-
149
-
150
-
151
-
152
-
153
-
154
-
155
-
156
-
157
-
158
-
159
-
160
-
161
-
162
-
163
-
164
-
165
-
166
-
167
-
168
-
169
-
170
-
171
-
172
-
173
-
174
-
175
-
176
-
177
-
178
-
179
-
180
-
181
-
182
-
183
-
184
-
185
-
186
-
187
-
188
-
189
-
190
-
191
-
192
-
193
-
194
-
195
-
196
-
197
-
198
-
199
-
200
-
201
-
202
-
203
-
204
-
205
-
206
-
207
 |
 |

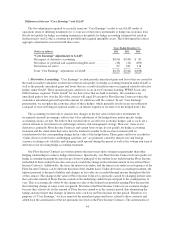
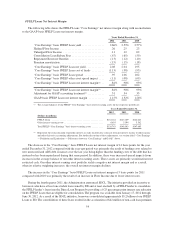
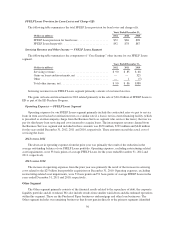
FFELP Loans Segment
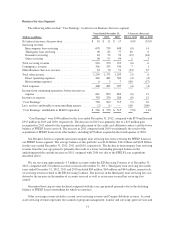
The following table includes “Core Earnings” results for our FFELP Loans segment.
Years Ended December 31, % Increase (Decrease)
(Dollars in millions) 2012 2011 2010 2012 vs. 2011 2011 vs. 2010
“Core Earnings” interest income:
FFELP Loans .................... $2,744 $2,914 $2,766 (6)% 5%
Cash and investments .............. 11 5 9 120 (44)
Total “Core Earnings” interest income . . 2,755 2,919 2,775 (6) 5
Total “Core Earnings” interest
expense ......................... 1,591 1,472 1,407 8 5
Net “Core Earnings” interest income .... 1,164 1,447 1,368 (20) 6
Less: provision for loan losses ......... 72 86 98 (16) (12)
Net “Core Earnings” interest income
after provision for loan losses ....... 1,092 1,361 1,270 (20) 7
Servicing revenue ................. 90 85 68 6 25
Other income .................... — 1 320 (100) (100)
Total other income .................. 90 86 388 5 (78)
Direct operating expenses .......... 702 760 736 (8) 3
Restructuring expenses ............. — 1 54 (100) (98)
Total expenses ..................... 702 761 790 (8) (4)
Income from continuing operations,
before income tax expense .......... 480 686 868 (30) (21)
Income tax expense ................. 173 252 311 (31) (19)
“Core Earnings” .................... $ 307 $ 434 $ 557 (29)% (22)%
“Core Earnings” from the FFELP Loans segment were $307 million in 2012, compared with $434 million
and $557 million in 2011 and 2010, respectively. The decrease in 2012 compared with 2011 is primarily due to
the declining balance of FFELP Loans and lower net interest margin as a result of an increase in the cost of
funds. The decrease in 2011 compared with 2010 is primarily due to the $321 million gain from the sale of loans
in 2010 that did not occur in 2011, which was partially offset by an increase in net interest margin as a result of
an increase in Floor Income due to lower interest rates. Key financial measures include:
• Net interest margin of .84 percent in the year ended December 31, 2012 compared with .98 percent and
.93 percent for the years ended December 31, 2011 and 2010, respectively. (See “FFELP Loans Net
Interest Margin” for further discussion.)
• The provision for loan losses continued to decline over the past two years as a result of improved credit
performance.
53