Sallie Mae 2012 Annual Report Download - page 147
Download and view the complete annual report
Please find page 147 of the 2012 Sallie Mae annual report below. You can navigate through the pages in the report by either clicking on the pages listed below, or by using the keyword search tool below to find specific information within the annual report.-
 1
1 -
2
-
3
-
4
-
5
-
6
-
7
-
8
-
9
-
10
-
11
-
12
-
13
-
14
-
15
-
16
-
17
-
18
-
19
-
20
-
21
-
22
-
23
-
24
-
25
-
26
-
27
-
28
-
29
-
30
-
31
-
32
-
33
-
34
-
35
-
36
-
37
-
38
-
39
-
40
-
41
-
42
-
43
-
44
-
45
-
46
-
47
-
48
-
49
-
50
-
51
-
52
-
53
-
54
-
55
-
56
-
57
-
58
-
59
-
60
-
61
-
62
-
63
-
64
-
65
-
66
-
67
-
68
-
69
-
70
-
71
-
72
-
73
-
74
-
75
-
76
-
77
-
78
-
79
-
80
-
81
-
82
-
83
-
84
-
85
-
86
-
87
-
88
-
89
-
90
-
91
-
92
-
93
-
94
-
95
-
96
-
97
-
98
-
99
-
100
-
101
-
102
-
103
-
104
-
105
-
106
-
107
-
108
-
109
-
110
-
111
-
112
-
113
-
114
-
115
-
116
-
117
-
118
-
119
-
120
-
121
-
122
-
123
-
124
-
125
-
126
-
127
-
128
-
129
-
130
-
131
-
132
-
133
-
134
-
135
-
136
-
 137
137 -
 138
138 -
 139
139 -
 140
140 -
 141
141 -
 142
142 -
 143
143 -
 144
144 -
 145
145 -
 146
146 -
 147
147 -
 148
148 -
 149
149 -
 150
150 -
 151
151 -
 152
152 -
 153
153 -
 154
154 -
 155
155 -
 156
156 -
 157
157 -
158
-
159
-
160
-
161
-
162
-
163
-
164
-
165
-
166
-
167
-
168
-
169
-
170
-
171
-
172
-
173
-
174
-
175
-
176
-
177
-
178
-
179
-
180
-
181
-
182
-
183
-
184
-
185
-
186
-
187
-
188
-
189
-
190
-
191
-
192
-
193
-
194
-
195
-
196
-
197
-
198
-
199
-
200
-
201
-
202
-
203
-
204
-
205
-
206
-
207
 |
 |

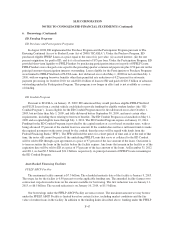
SLM CORPORATION
NOTES TO CONSOLIDATED FINANCIAL STATEMENTS (Continued)
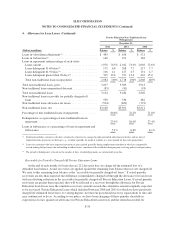
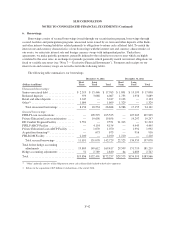
4. Allowance for Loan Losses (Continued)
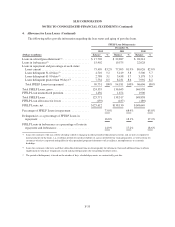
At December 31, 2012 and 2011, all of our TDR loans had a related allowance recorded. The following
table provides the recorded investment, unpaid principal balance and related allowance for our TDR loans.
TDR Loans
(Dollars in millions)
Recorded
Investment(1)
Unpaid
Principal
Balance
Related
Allowance
December 31, 2012
Private Education Loans — Traditional ................... $5,999 $6,074 $ 844
Private Education Loans — Non-Traditional ............... 1,295 1,303 282
Total .............................................. $7,294 $7,377 $1,126
December 31, 2011
Private Education Loans — Traditional ................... $4,201 $4,259 $ 546
Private Education Loans — Non-Traditional ............... 1,048 1,054 216
Total .............................................. $5,249 $5,313 $ 762
(1) The recorded investment is equal to the unpaid principal balance and accrued interest receivable net of unamortized deferred fees
and costs.
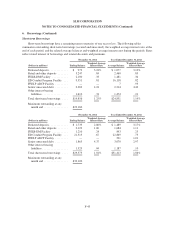
The following table provides the average recorded investment and interest income recognized for our TDR
loans.
Years Ended December 31,
2012 2011 2010
(Dollars in millions)
Average
Recorded
Investment
Interest
Income
Recognized
Average
Recorded
Investment
Interest
Income
Recognized
Average
Recorded
Investment
Interest
Income
Recognized
Private Education Loans —
Traditional ................... $5,243 $333 $1,960 $121 $210 $ 6
Private Education Loans — Non-
Traditional ................... 1,230 106 560 48 156 7
Total .......................... $6,473 $439 $2,520 $169 $366 $13
F-37