Sallie Mae 2012 Annual Report Download - page 186
Download and view the complete annual report
Please find page 186 of the 2012 Sallie Mae annual report below. You can navigate through the pages in the report by either clicking on the pages listed below, or by using the keyword search tool below to find specific information within the annual report.-
 1
1 -
2
-
3
-
4
-
5
-
6
-
7
-
8
-
9
-
10
-
11
-
12
-
13
-
14
-
15
-
16
-
17
-
18
-
19
-
20
-
21
-
22
-
23
-
24
-
25
-
26
-
27
-
28
-
29
-
30
-
31
-
32
-
33
-
34
-
35
-
36
-
37
-
38
-
39
-
40
-
41
-
42
-
43
-
44
-
45
-
46
-
47
-
48
-
49
-
50
-
51
-
52
-
53
-
54
-
55
-
56
-
57
-
58
-
59
-
60
-
61
-
62
-
63
-
64
-
65
-
66
-
67
-
68
-
69
-
70
-
71
-
72
-
73
-
74
-
75
-
76
-
77
-
78
-
79
-
80
-
81
-
82
-
83
-
84
-
85
-
86
-
87
-
88
-
89
-
90
-
91
-
92
-
93
-
94
-
95
-
96
-
97
-
98
-
99
-
100
-
101
-
102
-
103
-
104
-
105
-
106
-
107
-
108
-
109
-
110
-
111
-
112
-
113
-
114
-
115
-
116
-
117
-
118
-
119
-
120
-
121
-
122
-
123
-
124
-
125
-
126
-
127
-
128
-
129
-
130
-
131
-
132
-
133
-
134
-
135
-
136
-
137
-
138
-
139
-
140
-
141
-
142
-
143
-
144
-
145
-
146
-
147
-
148
-
149
-
150
-
151
-
152
-
153
-
154
-
155
-
156
-
157
-
158
-
159
-
160
-
161
-
162
-
163
-
164
-
165
-
166
-
167
-
168
-
169
-
170
-
171
-
172
-
173
-
174
-
175
-
 176
176 -
 177
177 -
 178
178 -
 179
179 -
 180
180 -
 181
181 -
 182
182 -
 183
183 -
 184
184 -
 185
185 -
 186
186 -
 187
187 -
 188
188 -
 189
189 -
 190
190 -
 191
191 -
 192
192 -
 193
193 -
 194
194 -
 195
195 -
 196
196 -
197
-
198
-
199
-
200
-
201
-
202
-
203
-
204
-
205
-
206
-
207
 |
 |
SLM CORPORATION
NOTES TO CONSOLIDATED FINANCIAL STATEMENTS (Continued)
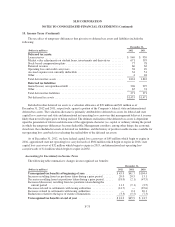
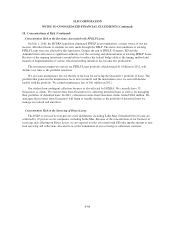
15. Income Taxes (Continued)
As of December 31, 2012, the gross unrecognized tax benefits are $41.2 million. Included in the
$41.2 million are $27.5 million of unrecognized tax benefits that, if recognized, would favorably impact the
effective tax rate.
The Company or one of its subsidiaries files income tax returns at the U.S. federal level, in most U.S. states,
and various foreign jurisdictions. U.S. federal income tax returns filed for years 2010 and prior have either been
audited or surveyed and are now resolved. Various combinations of subsidiaries, tax years, and jurisdictions
remain open for review, subject to statute of limitations periods (typically 3 to 4 prior years). We do not expect
the resolution of open audits to have a material impact on our unrecognized tax benefits.
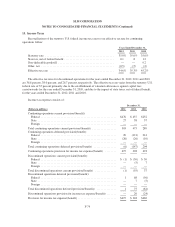
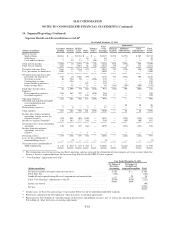
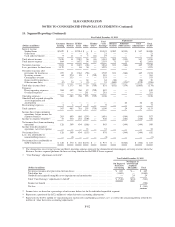
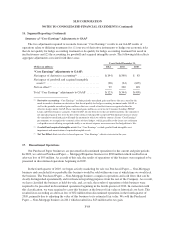
16. Segment Reporting
We monitor and assess our ongoing operations and results by three primary operating segments — the
Consumer Lending operating segment, the Business Services operating segment and the FFELP Loan operating
segment. These three operating segments meet the quantitative thresholds for reportable segments. Accordingly,
the results of operations of our Consumer Lending, Business Services and FFELP Loans segments are presented
separately. We have smaller operating segments that consist of business operations that have either been
discontinued or are winding down. These operating segments do not meet the quantitative thresholds to be
considered reportable segments. As a result, the results of operations for these operating segments (Purchased
Paper business and mortgage and other loan business) are combined with gains/losses from the repurchase of
debt, the financial results of our corporate liquidity portfolio and all overhead within the Other reportable
segment. The management reporting process measures the performance of our operating segments based on our
management structure, as well as the methodology we used to evaluate performance and allocate resources.
Management, including our chief operating decision makers, evaluates the performance of our operating
segments based on their profitability. As discussed further below, we measure the profitability of our operating
segments based on “Core Earnings.” Accordingly, information regarding our reportable segments is provided
based on a “Core Earnings” basis.
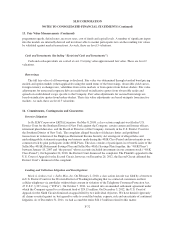
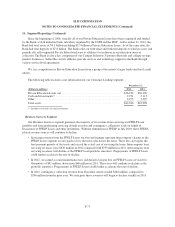
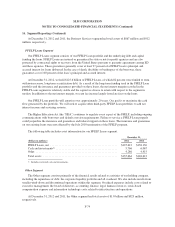
Consumer Lending Segment
In this segment, we originate, acquire, finance and service Private Education Loans. The Private Education
Loans we make are primarily to bridge the gap between the cost of higher education and the amount funded
through financial aid, federal loans or customers’ resources. We will continue to offer loan products to parents
and graduate students where we believe we are competitive with similar federal education loan products. In this
segment, we earn net interest income on the Private Education Loan portfolio (after provision for loan losses) as
well as servicing fees, consisting primarily of late fees. Operating expenses for this segment include costs
incurred to acquire and service our loans.
Private Education Loans bear the full credit risk of the customer and cosigner. We manage this risk by
underwriting and pricing based upon customized credit scoring criteria and the addition of qualified cosigners.
For the year ended December 31, 2012, our annual charge-off rate for Private Education Loans (as a percentage
of loans in repayment) was 3.4 percent, as compared to 3.7 percent for the prior year.
In 2012, we originated $3.3 billion of Private Education Loans, an increase of 22 percent and 45 percent
from years ended December 31, 2011 and 2010, respectively. As of December 31, 2012 and 2011, we had
$36.9 billion and $36.3 billion of Private Education Loans outstanding, respectively. At December 31, 2012,
52 percent of our Private Education Loan portfolio was funded to term with non-recourse, long-term
securitization debt.
F-76