Sallie Mae 2012 Annual Report Download - page 146
Download and view the complete annual report
Please find page 146 of the 2012 Sallie Mae annual report below. You can navigate through the pages in the report by either clicking on the pages listed below, or by using the keyword search tool below to find specific information within the annual report.-
 1
1 -
2
-
3
-
4
-
5
-
6
-
7
-
8
-
9
-
10
-
11
-
12
-
13
-
14
-
15
-
16
-
17
-
18
-
19
-
20
-
21
-
22
-
23
-
24
-
25
-
26
-
27
-
28
-
29
-
30
-
31
-
32
-
33
-
34
-
35
-
36
-
37
-
38
-
39
-
40
-
41
-
42
-
43
-
44
-
45
-
46
-
47
-
48
-
49
-
50
-
51
-
52
-
53
-
54
-
55
-
56
-
57
-
58
-
59
-
60
-
61
-
62
-
63
-
64
-
65
-
66
-
67
-
68
-
69
-
70
-
71
-
72
-
73
-
74
-
75
-
76
-
77
-
78
-
79
-
80
-
81
-
82
-
83
-
84
-
85
-
86
-
87
-
88
-
89
-
90
-
91
-
92
-
93
-
94
-
95
-
96
-
97
-
98
-
99
-
100
-
101
-
102
-
103
-
104
-
105
-
106
-
107
-
108
-
109
-
110
-
111
-
112
-
113
-
114
-
115
-
116
-
117
-
118
-
119
-
120
-
121
-
122
-
123
-
124
-
125
-
126
-
127
-
128
-
129
-
130
-
131
-
132
-
133
-
134
-
135
-
 136
136 -
 137
137 -
 138
138 -
 139
139 -
 140
140 -
 141
141 -
 142
142 -
 143
143 -
 144
144 -
 145
145 -
 146
146 -
 147
147 -
 148
148 -
 149
149 -
 150
150 -
 151
151 -
 152
152 -
 153
153 -
 154
154 -
 155
155 -
 156
156 -
157
-
158
-
159
-
160
-
161
-
162
-
163
-
164
-
165
-
166
-
167
-
168
-
169
-
170
-
171
-
172
-
173
-
174
-
175
-
176
-
177
-
178
-
179
-
180
-
181
-
182
-
183
-
184
-
185
-
186
-
187
-
188
-
189
-
190
-
191
-
192
-
193
-
194
-
195
-
196
-
197
-
198
-
199
-
200
-
201
-
202
-
203
-
204
-
205
-
206
-
207
 |
 |

SLM CORPORATION
NOTES TO CONSOLIDATED FINANCIAL STATEMENTS (Continued)
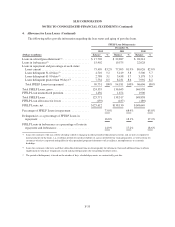
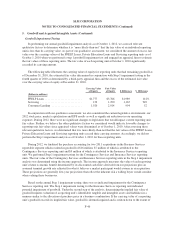
4. Allowance for Loan Losses (Continued)
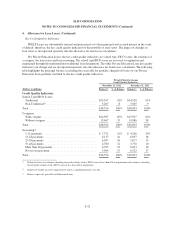
partially charged-off Private Education Loans and we will continue to do so. Differences in actual future
recoveries on these defaulted loans could affect our receivable for partially charged-off Private Education Loans.
There was $198 million and $148 million in allowance for Private Education Loan losses at December 31, 2012
and 2011, respectively, providing for possible additional future charge-offs related to the receivable for partially
charged-off Private Education Loans.
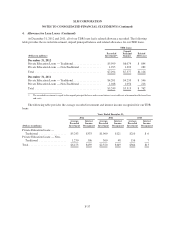
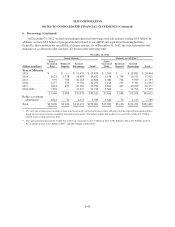
The following table summarizes the activity in the receivable for partially charged-off loans.
Years Ended December 31,
(Dollars in millions) 2012 2011 2010
Receivable at beginning of period .............................. $1,241 $1,040 $ 499
Expected future recoveries of current period defaults(1) ............. 351 391 459
Recoveries(2) ............................................... (189) (155) (104)
Charge-offs(3) .............................................. (56) (35) (43)
Consolidation of securitization trusts(4) .......................... — — 229
Receivable at end of period ................................... 1,347 1,241 1,040
Allowance for estimated recovery shortfalls(5) ..................... (198) (148) —
Net receivable at end of period ................................ $1,149 $1,093 $1,040
(1) Represents the difference between the loan balance and our estimate of the amount to be collected in the future.
(2) Current period cash collections.
(3) Represents the current period recovery shortfall – the difference between what was expected to be collected and what was actually
collected. These amounts are included in the Private Education Loan total charge-offs as reported in the “Allowance for Loan
Losses Metrics” tables.
(4) On January 1, 2010, upon the adoption of the new consolidation accounting guidance all off-balance sheet loans were consolidated
on-balance sheet.
(5) The allowance for estimated recovery shortfalls of the receivable for partially charged-off Private Education Loans is a component
of the $2.2 billion overall allowance for Private Education Loan losses as of December 31, 2012 and 2011, respectively.
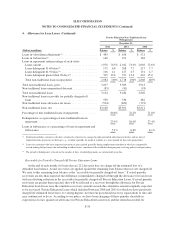
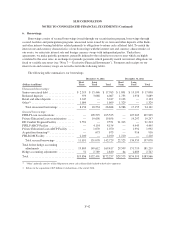
Troubled Debt Restructurings (“TDRs”)
We modify the terms of loans for certain customers when we believe such modifications may increase the
ability and willingness of a customer to make payments and thus increase the ultimate overall amount collected
on a loan. These modifications generally take the form of a forbearance, a temporary interest rate reduction or an
extended repayment plan. For customers experiencing financial difficulty, certain Private Education Loans for
which we have granted either a forbearance of greater than three months, an interest rate reduction or an extended
repayment plan are classified as TDRs. Forbearance provides customers the ability to defer payments for a period
of time, but does not result in the forgiveness of any principal or interest. While in forbearance status, interest
continues to accrue and is capitalized to principal when the loan re-enters repayment status. The recorded
investment of loans granted a forbearance that were classified as TDRs was $6.4 billion and $4.5 billion at
December 30, 2012 and 2011, respectively. The recorded investment for TDRs from loans granted interest rate
reductions or extended repayment plans was $0.9 billion and $0.7 billion at December 31, 2012 and 2011,
respectively. At December 31, 2012 and 2011, the percentage of loans granted forbearance that have migrated to
a TDR classification due to the extension of the forbearance period was 43 percent and 33 percent, respectively.
F-36