IBM 2010 Annual Report Download - page 97
Download and view the complete annual report
Please find page 97 of the 2010 IBM annual report below. You can navigate through the pages in the report by either clicking on the pages listed below, or by using the keyword search tool below to find specific information within the annual report.-
 1
1 -
2
-
3
-
4
-
5
-
6
-
7
-
8
-
9
-
10
-
11
-
12
-
13
-
14
-
15
-
16
-
17
-
18
-
19
-
20
-
21
-
22
-
23
-
24
-
25
-
26
-
27
-
28
-
29
-
30
-
31
-
32
-
33
-
34
-
35
-
36
-
37
-
38
-
39
-
40
-
41
-
42
-
43
-
44
-
45
-
46
-
47
-
48
-
49
-
50
-
51
-
52
-
53
-
54
-
55
-
56
-
57
-
58
-
59
-
60
-
61
-
62
-
63
-
64
-
65
-
66
-
67
-
68
-
69
-
70
-
71
-
72
-
73
-
74
-
75
-
76
-
77
-
78
-
79
-
80
-
81
-
82
-
83
-
84
-
85
-
86
-
 87
87 -
 88
88 -
 89
89 -
 90
90 -
 91
91 -
 92
92 -
 93
93 -
 94
94 -
 95
95 -
 96
96 -
 97
97 -
 98
98 -
 99
99 -
 100
100 -
 101
101 -
 102
102 -
 103
103 -
 104
104 -
 105
105 -
 106
106 -
 107
107 -
108
-
109
-
110
-
111
-
112
-
113
-
114
-
115
-
116
-
117
-
118
-
119
-
120
-
121
-
122
-
123
-
124
-
125
-
126
-
127
-
128
-
129
-
130
-
131
-
132
-
133
-
134
-
135
-
136
-
137
-
138
-
139
-
140
 |
 |

Notes to Consolidated Financial Statements
International Business Machines Corporation and Subsidiary Companies 95
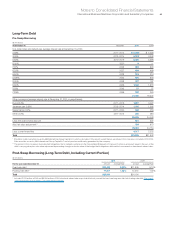
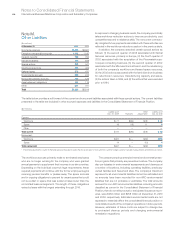
Long-Term Debt
Pre-Swap Borrowing
($ in millions)
At December 31: Maturities 2010 2009
U.S. dollar notes and debentures (average interest rate at December 31, 2010):
2.88% 2011 – 2012 $ 6,326* $ 5,456
3.76% 2013 – 2014 5,019* 3,332
5.92% 2015 –2019 6,350 5,396
5.00% 2020 9 —
7.00% 2025 600 600
6.22% 2027 469 469
6.50% 2028 313 313
5.875% 2032 600 600
8.00% 2038 187 187
5.60% 2039 1,545 1,518
7.00% 2045 27 27
7.125% 2096 322 350
21,766 18,247
Other currencies (average interest rate at December 31, 2010, in parentheses):
Euros (5.4%) 2011 – 2016 1,897 3,427
Japanese yen (0.9%) 2013 – 2014 1,162 1,565
Swiss francs (3.4%) 2011 – 2020 540 484
Other (4.5%) 2011
–
2013 240 285
25,606 24,008
Less: net unamortized discount 531 527
Add: fair value adjustment** 788 673
25,863 24,154
Less: current maturities 4,017 2,222
Tot a l $21,846 $21,932
* $1.6 billion in debt securities issued by IBM International Group Capital LLC, which is an indirect, 100 percent owned finance subsidiary of the company, is included in 2011-2014.
Debt securities issued by IBM International Group Capital LLC are fully and unconditionally guaranteed by the company.
** The portion of the company’s fixed-rate debt obligations that is hedged is reflected in the Consolidated Statement of Financial Position as an amount equal to the sum of the
debt’s carrying value plus a fair value adjustment representing changes in the fair value of the hedged debt obligations attributable to movements in benchmark interest rates.
Post-Swap Borrowing (Long-Term Debt, Including Current Portion)
($ in millions)
2010 2009
For the year ended December 31: Amount Average Rate Amount Average Rate
Fixed-rate debt $14,446 5.29% $11,939 6.13%
Floating-rate debt* 11,417 1.23% 12,215 1.22%
Tot a l $25,863 $24,154
* Includes $7,078 million in 2010 and $9,054 million in 2009 of notional interest rate swaps that effectively convert the fixed-rate long-term debt into floating-rate debt. (See note L,
“Derivative Financial Instruments,” on pages 96 through 101.)