IBM 2010 Annual Report Download - page 89
Download and view the complete annual report
Please find page 89 of the 2010 IBM annual report below. You can navigate through the pages in the report by either clicking on the pages listed below, or by using the keyword search tool below to find specific information within the annual report.-
 1
1 -
2
-
3
-
4
-
5
-
6
-
7
-
8
-
9
-
10
-
11
-
12
-
13
-
14
-
15
-
16
-
17
-
18
-
19
-
20
-
21
-
22
-
23
-
24
-
25
-
26
-
27
-
28
-
29
-
30
-
31
-
32
-
33
-
34
-
35
-
36
-
37
-
38
-
39
-
40
-
41
-
42
-
43
-
44
-
45
-
46
-
47
-
48
-
49
-
50
-
51
-
52
-
53
-
54
-
55
-
56
-
57
-
58
-
59
-
60
-
61
-
62
-
63
-
64
-
65
-
66
-
67
-
68
-
69
-
70
-
71
-
72
-
73
-
74
-
75
-
76
-
77
-
78
-
 79
79 -
 80
80 -
 81
81 -
 82
82 -
 83
83 -
 84
84 -
 85
85 -
 86
86 -
 87
87 -
 88
88 -
 89
89 -
 90
90 -
 91
91 -
 92
92 -
 93
93 -
 94
94 -
 95
95 -
 96
96 -
 97
97 -
 98
98 -
 99
99 -
100
-
101
-
102
-
103
-
104
-
105
-
106
-
107
-
108
-
109
-
110
-
111
-
112
-
113
-
114
-
115
-
116
-
117
-
118
-
119
-
120
-
121
-
122
-
123
-
124
-
125
-
126
-
127
-
128
-
129
-
130
-
131
-
132
-
133
-
134
-
135
-
136
-
137
-
138
-
139
-
140
 |
 |

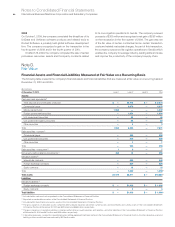
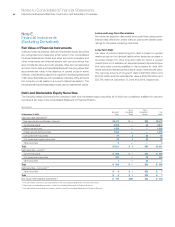
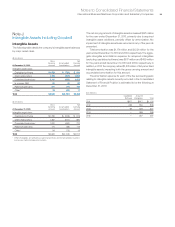
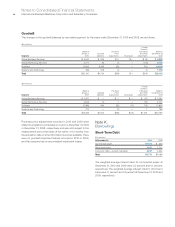
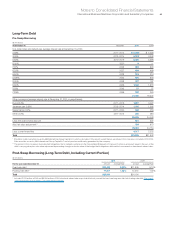
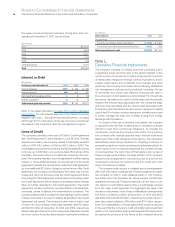
Notes to Consolidated Financial Statements
International Business Machines Corporation and Subsidiary Companies 87
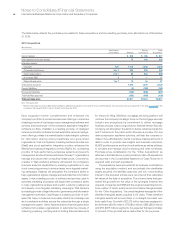
($ in millions)
At December 31, 2009: Level 1 Level 2 Level 3 Total
Assets:
Cash and cash equivalents
(1)
Time deposits and certificates of deposit $ — $4,324 $ — $ 4,324
Commercial paper — 2,099 — 2,099
Money market funds 2,780 — — 2,780
Other securities — 74 — 74
Tota l 2,780 6,497 — 9,277
Debt securities—current
(2)
Commercial paper — 1,491 — 1,491
U.S. government securities — 300 — 300
Tota l — 1,791 — 1,791
Debt securities—noncurrent
(3) 3 6 — 9
Non-equity method alliance investments
(3) 366 8 — 374
Derivative assets
(4)
Interest rate contracts — 426 — 426
Foreign exchange contracts — 407 — 407
Equity contracts — 5 — 5
Tota l — 838 — 838
(6)
Total assets $3,149 $9,140 $ — $12,289
Liabilities:
Derivative liabilities
(5)
Interest rate contracts $ — $ 2 $ — $ 2
Foreign exchange contracts — 1,553 — 1,553
Total liabilities $ — $1,555 $ — $ 1,555
(6)
(1) Included within cash and cash equivalents in the Consolidated Statement of Financial Position.
(2)
Reported as marketable securities in the Consolidated Statement of Financial Position.
(3) Included within investments and sundry assets in the Consolidated Statement of Financial Position.
(4)
The gross balances of derivative assets contained within prepaid expenses and other current assets, and investments and sundry assets in the Consolidated Statement of
Financial Position at December 31, 2009 are $273 million and $565 million, respectively.
(5) The gross balances of derivative liabilities contained within other accrued expenses and liabilities, and other liabilities in the Consolidated Statement of Financial Position at
December 31, 2009 are $906 million and $649 million, respectively.
(6) If derivative exposures covered by a qualifying master netting agreement had been netted in the Consolidated Statement of Financial Position, the total derivative asset and
liability positions would have been reduced by $573 million each.
There were no significant transfers between Levels 1 and 2 for the years ended December 31, 2010 and 2009.
Items Measured at Fair Value
on a Nonrecurring Basis
In 2008, the company recorded an other-than-temporary impair-
ment of $81 million for an equity method investment. The resulting
investment which was classified as Level 3 in the fair value hierarchy
was valued using a discounted cash flow model. The valuation
inputs included an estimate of future cash flows, expectations
about possible variations in the amount and timing of cash flows
and a discount rate based on the risk-adjusted cost of capital.
Potential results were assigned probabilities that resulted in a
weighted average or most-likely discounted cash flow fair value
as of December 31, 2008. During 2009, the balance of this invest-
ment was further reduced by an additional impairment of $5 million
and other adjustments primarily related to dividends. The balance
of this investment was zero at December 31, 2009. In the third
quarter of 2010, this investment was sold.