IBM 2010 Annual Report Download - page 125
Download and view the complete annual report
Please find page 125 of the 2010 IBM annual report below. You can navigate through the pages in the report by either clicking on the pages listed below, or by using the keyword search tool below to find specific information within the annual report.-
 1
1 -
2
-
3
-
4
-
5
-
6
-
7
-
8
-
9
-
10
-
11
-
12
-
13
-
14
-
15
-
16
-
17
-
18
-
19
-
20
-
21
-
22
-
23
-
24
-
25
-
26
-
27
-
28
-
29
-
30
-
31
-
32
-
33
-
34
-
35
-
36
-
37
-
38
-
39
-
40
-
41
-
42
-
43
-
44
-
45
-
46
-
47
-
48
-
49
-
50
-
51
-
52
-
53
-
54
-
55
-
56
-
57
-
58
-
59
-
60
-
61
-
62
-
63
-
64
-
65
-
66
-
67
-
68
-
69
-
70
-
71
-
72
-
73
-
74
-
75
-
76
-
77
-
78
-
79
-
80
-
81
-
82
-
83
-
84
-
85
-
86
-
87
-
88
-
89
-
90
-
91
-
92
-
93
-
94
-
95
-
96
-
97
-
98
-
99
-
100
-
101
-
102
-
103
-
104
-
105
-
106
-
107
-
108
-
109
-
110
-
111
-
112
-
113
-
114
-
 115
115 -
 116
116 -
 117
117 -
 118
118 -
 119
119 -
 120
120 -
 121
121 -
 122
122 -
 123
123 -
 124
124 -
 125
125 -
 126
126 -
 127
127 -
 128
128 -
 129
129 -
 130
130 -
 131
131 -
 132
132 -
 133
133 -
 134
134 -
 135
135 -
136
-
137
-
138
-
139
-
140
 |
 |

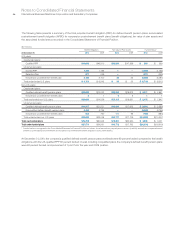
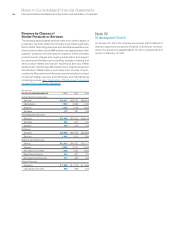
Notes to Consolidated Financial Statements
International Business Machines Corporation and Subsidiary Companies 123
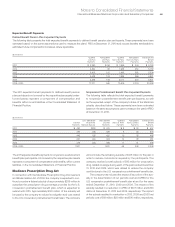
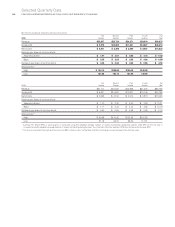
The following tables present the reconciliation of the beginning and ending balances of Level 3 assets for the years ended December 31,
2010 and 2009 for the U.S. Plan:
($ in millions)
Equity Mortgage and Fixed Income
Commingled/ Asset-Backed Commingled/ Hedge Private Private
Mutual Funds Securities Mutual Funds Funds Equity Real Estate Total
Balance at January 1, 2010 $ 26 $37 $192 $587 $3,877 $2,247 $6,964
Return on assets held at end of year 24 3 30 45 829 123 1,054
Return on assets sold during the year (0) 0 — 3 (153) 16 (133)
Purchases, sales and settlements, net 139 11 — (11) (302) 248 85
Transfers, net (188)* 4 — — — — (184)
Balance at December 31, 2010 $ — $56 $221 $624 $4,251 $2,634 $7,786
* During the year ended December 31, 2010, the fund hired an independent administrator responsible for valuing the fund. As a result of this action the asset was transferred from
Level 3 to Level 2.
($ in millions)
Equity Mortgage and Fixed Income
Commingled/ Asset-Backed Commingled/ Hedge Private Private
Mutual Funds Securities Mutual Funds Funds Equity Real Estate Total
Balance at January 1, 2009 $ — $ 47 $180 $513 $3,169 $2,698 $6,607
Return on assets held at end of year 1 11 11 80 575 (634) 44
Return on assets sold during the year — 1 — 2 14 (98) (81)
Purchases, sales and settlements, net 25 (7) — (8) 118 281 408
Transfers, net — (14) — — — — (14)
Balance at December 31, 2009 $26 $ 37 $192 $587 $3,877 $2,247 $6,964
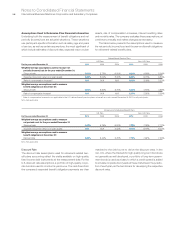
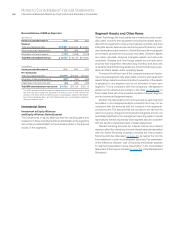
The following tables present the reconciliation of the beginning and ending balances of Level 3 assets for the years ended December 31,
2010 and 2009 for the non-U.S. Plans:
($ in millions)
Corporate Private Private
Bonds Equity Real Estate Total
Balance at January 1, 2010 $ — $ 93 $492 $585
Return on assets held at end of year (0) 14 41 55
Return on assets sold during the year — 3 (3) 0
Purchases, sales and settlements, net 4 69 9 82
Transfers, net 7 (0) — 7
Foreign exchange impact 0 (3) (6) (8)
Balance at December 31, 2010 $11 $176 $533 $720
($ in millions)
Private Private
Equity Real Estate Total
Balance at January 1, 2009 $ 64 $429 $494
Return on assets held at end of year (10) (10) (19)
Return on assets sold during the year — — 1
Purchases, sales and settlements, net 32 27 59
Transfers, net — — —
Foreign exchange impact 6 46 51
Balance at December 31, 2009 $ 93 $492 $585