IBM 2010 Annual Report Download - page 36
Download and view the complete annual report
Please find page 36 of the 2010 IBM annual report below. You can navigate through the pages in the report by either clicking on the pages listed below, or by using the keyword search tool below to find specific information within the annual report.-
 1
1 -
2
-
3
-
4
-
5
-
6
-
7
-
8
-
9
-
10
-
11
-
12
-
13
-
14
-
15
-
16
-
17
-
18
-
19
-
20
-
21
-
22
-
23
-
24
-
25
-
 26
26 -
 27
27 -
 28
28 -
 29
29 -
 30
30 -
 31
31 -
 32
32 -
 33
33 -
 34
34 -
 35
35 -
 36
36 -
 37
37 -
 38
38 -
 39
39 -
 40
40 -
 41
41 -
 42
42 -
 43
43 -
 44
44 -
 45
45 -
 46
46 -
47
-
48
-
49
-
50
-
51
-
52
-
53
-
54
-
55
-
56
-
57
-
58
-
59
-
60
-
61
-
62
-
63
-
64
-
65
-
66
-
67
-
68
-
69
-
70
-
71
-
72
-
73
-
74
-
75
-
76
-
77
-
78
-
79
-
80
-
81
-
82
-
83
-
84
-
85
-
86
-
87
-
88
-
89
-
90
-
91
-
92
-
93
-
94
-
95
-
96
-
97
-
98
-
99
-
100
-
101
-
102
-
103
-
104
-
105
-
106
-
107
-
108
-
109
-
110
-
111
-
112
-
113
-
114
-
115
-
116
-
117
-
118
-
119
-
120
-
121
-
122
-
123
-
124
-
125
-
126
-
127
-
128
-
129
-
130
-
131
-
132
-
133
-
134
-
135
-
136
-
137
-
138
-
139
-
140
 |
 |

34
Management Discussion
International Business Machines Corporation and Subsidiary Companies
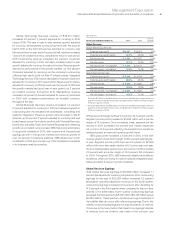
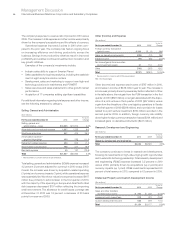
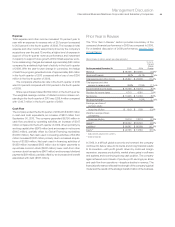
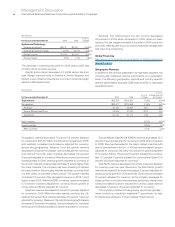
Earnings Per Share
Basic earnings per share is computed on the basis of the weighted-
average number of shares of common stock outstanding during
the period. Diluted earnings per share is computed on the basis of
the weighted-average number of shares of common stock outstand-
ing plus the effect of dilutive potential common shares outstanding
during the period using the treasury stock method. Dilutive potential
common shares include outstanding stock options, share awards
and convertible notes.
Yr.-to-Yr.
For the year ended December 31: 2010 2009 Change
Earnings per share of common stock:
Assuming dilution $11.52 $10.01 15.1%
Basic $11.69 $10.12 15.5%
Weighted-average shares
outstanding (in millions):
Assuming dilution 1,287.4 1,341.4 (4.0)%
Basic 1,268.8 1,327.2 (4.4)%
Actual shares outstanding at December 31, 2010 and 2009 were
1,228.0 million and 1,305.3 million, respectively. The average
number of common shares outstanding assuming dilution was
54.0 million shares lower in 2010 versus 2009. The decrease was
primarily the result of the common stock repurchase program. See
note N, “Equity Activity,” on page 103 for additional information
regarding common stock activities. Also see note R, “Earnings
Per Share of Common Stock,” on page 108.
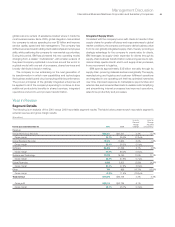
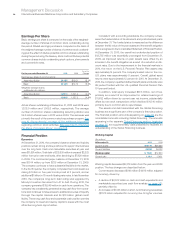
Financial Position
Dynamics
At December 31, 2010, the company’s balance sheet and liquidity
positions remain strong and are positioned to support the business
over the long term. Cash and marketable securities at year end
were $11,651 million. Total debt of $28,624 million increased $2,525
million from prior year-end levels, after declining by $7,826 million
in 2009. The commercial paper balance at December 31, 2010
was $1,144 million, up from $235 million at December 31, 2009.
The company continues to have substantial flexibility in the market.
In the fourth quarter, the company completed two bond issuances
raising $1 billion in five-year bonds priced at 2 percent, and an
additional $1 billion in 18-month floating rate notes. In late November
2010, the company’s long-term debt rating was upgraded by
Moody’s Investors Services from A1 to Aa3. During 2010, the
company generated $19,549 million in cash from operations. The
company has consistently generated strong cash flow from opera-
tions and continues to have access to additional sources of liquidity
through the capital markets and its $10 billion global credit
facility. The strong cash flow and substantial cash position permits
the company to invest and deploy capital to areas with the most
attractive long-term opportunities.
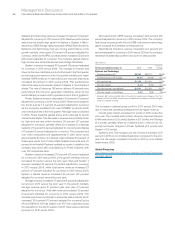
Consistent with accounting standards, the company remea-
sures the funded status of its retirement and postretirement plans
at December 31. The funded status is measured as the difference
between the fair value of the plan assets and the benefit obligation
and is recognized in the Consolidated Statement of Financial Position.
At December 31, 2010, the overall net underfunded position of
$13,735 million was essentially unchanged from December 31,
2009, as improved returns on plan assets were offset by an
increase in the benefit obligation as a result of a reduction in dis-
count rates. Due to the improvement in the financial markets in
2010, the return on the U.S. Personal Pension Plan assets was
approximately 14 percent. The company’s asset return in the non-
U.S. plans was approximately 9 percent. Overall, global asset
returns were approximately 12 percent in 2010. At December 31,
2010, the company’s qualified defined benefit plans worldwide were
99 percent funded with the U.S. qualified Personal Pension Plan
101 percent funded.
In addition, total equity increased $418 million, net of tax,
primarily as a result of an improvement in retained earnings of
$11,632 million driven by current year net income, substantially
offset by net stock transactions which declined $11,310 million
primarily due to common stock repurchases.
The assets and debt associated with the Global Financing
business are a significant part of the company’s financial position.
The financial position amounts appearing on page 63 are the
consolidated amounts including Global Financing. The amounts
appearing in the separate Global Financing section, beginning
on page 55, are supplementary data presented to facilitate an
understanding of the Global Financing business.
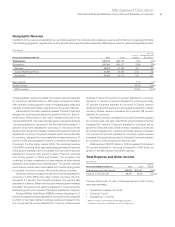
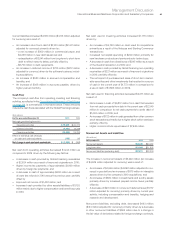
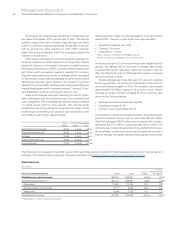
Working Capital
($ in millions)
At December 31: 2010 2009
Current assets $48,116 $48,935
Current liabilities 40,562 36,002
Working capital $ 7,554 $12,933
Current ratio 1.19:1 1.36:1
Working capital decreased $5,379 million from the year-end 2009
position. The key changes are described below:
Current assets decreased $819 million ($1,000 million adjusted
for currency), driven by:
• A decline of $2,322 million in cash and cash equivalents and
marketable securities (see cash flow analysis on page 35);
partially offset by
• An increase of $1,343 million in short-term financing receivables
($1,122 million adjusted for currency) due to higher volumes.