IBM 2010 Annual Report Download - page 129
Download and view the complete annual report
Please find page 129 of the 2010 IBM annual report below. You can navigate through the pages in the report by either clicking on the pages listed below, or by using the keyword search tool below to find specific information within the annual report.-
 1
1 -
2
-
3
-
4
-
5
-
6
-
7
-
8
-
9
-
10
-
11
-
12
-
13
-
14
-
15
-
16
-
17
-
18
-
19
-
20
-
21
-
22
-
23
-
24
-
25
-
26
-
27
-
28
-
29
-
30
-
31
-
32
-
33
-
34
-
35
-
36
-
37
-
38
-
39
-
40
-
41
-
42
-
43
-
44
-
45
-
46
-
47
-
48
-
49
-
50
-
51
-
52
-
53
-
54
-
55
-
56
-
57
-
58
-
59
-
60
-
61
-
62
-
63
-
64
-
65
-
66
-
67
-
68
-
69
-
70
-
71
-
72
-
73
-
74
-
75
-
76
-
77
-
78
-
79
-
80
-
81
-
82
-
83
-
84
-
85
-
86
-
87
-
88
-
89
-
90
-
91
-
92
-
93
-
94
-
95
-
96
-
97
-
98
-
99
-
100
-
101
-
102
-
103
-
104
-
105
-
106
-
107
-
108
-
109
-
110
-
111
-
112
-
113
-
114
-
115
-
116
-
117
-
118
-
 119
119 -
 120
120 -
 121
121 -
 122
122 -
 123
123 -
 124
124 -
 125
125 -
 126
126 -
 127
127 -
 128
128 -
 129
129 -
 130
130 -
 131
131 -
 132
132 -
 133
133 -
 134
134 -
 135
135 -
 136
136 -
 137
137 -
 138
138 -
 139
139 -
140
 |
 |

Notes to Consolidated Financial Statements
International Business Machines Corporation and Subsidiary Companies 127
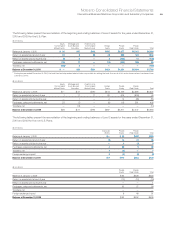
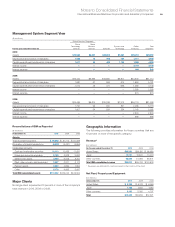
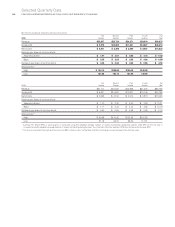
The following tables reflect the results of the segments consistent with the company’s management and measurement system. These results
are not necessarily a depiction that is in conformity with GAAP. Performance measurement is based on pre-tax income. These results
are used, in part, by senior management, both in evaluating the performance of, and in allocating resources to, each of the segments.
Management System Segment View
($ in millions)
Global Services Segments
Global Global
Technology Business Systems and Global Total
For the year ended December 31: Services Services Software Technology Financing Segments
2010:
External revenue $38,201 $18,223 $22,485 $ 17,973 $2,238 $ 99,120
Internal revenue 1,313 798 2,950 804 1,842 7,707
Total revenue $39,514 $19,021 $25,436 $18,777 $4,080 $106,827
Pre-tax income $ 5,568 $ 2,569 $ 9,097 $ 1,586 $1,959 $ 20,778
Revenue year-to-year change 2.0% 2.6% 5.7% 9.8% 0.1% 4.2%
Pre-tax income year-to-year change 0.6% 0.5% 12.4% 11.8% 13.3% 7.5%
Pre-tax income margin 14.1% 13.5% 35.8% 8.4% 48.0% 19.5%
2009:
External revenue $37,347 $17,653 $21,396 $ 16,190 $2,302 $ 94,889
Internal revenue 1,386 887 2,677 911 1,774 7,635
Total revenue $38,734 $18,540 $24,073 $17,102 $4,076 $102,524
Pre-tax income $ 5,537 $ 2,555 $ 8,095 $ 1,419 $1,730 $ 19,335
Revenue year-to-year change (5.1)% (10.3)% (3.1)% (15.2)% (8.4)% (7.6)%
Pre-tax income year-to-year change 20.2% (4.7)% 14.4% (8.5)% 7.0% 10.3%
Pre-tax income margin 14.3% 13.8% 33.6% 8.3% 42.4% 18.9%
2008:
External revenue $39,264 $19,628 $22,089 $ 19,287 $2,559 $102,827
Internal revenue 1,546 1,044 2,761 882 1,892 8,125
Total revenue $40,810 $20,671 $24,850 $20,169 $4,451 $110,951
Pre-tax income $ 4,607 $ 2,681 $ 7,075 $ 1,550 $1,617 $ 17,531
Revenue year-to-year change 8.1% 7.5% 10.9% (9.6)% 11.7% 5.0%
Pre-tax income year-to-year change 29.5% 29.9% 17.9% (28.0)% 16.7% 15.6%
Pre-tax income margin 11.3% 13.0% 28.5% 7.7% 36.3% 15.8%