IBM 2010 Annual Report Download - page 135
Download and view the complete annual report
Please find page 135 of the 2010 IBM annual report below. You can navigate through the pages in the report by either clicking on the pages listed below, or by using the keyword search tool below to find specific information within the annual report.-
 1
1 -
2
-
3
-
4
-
5
-
6
-
7
-
8
-
9
-
10
-
11
-
12
-
13
-
14
-
15
-
16
-
17
-
18
-
19
-
20
-
21
-
22
-
23
-
24
-
25
-
26
-
27
-
28
-
29
-
30
-
31
-
32
-
33
-
34
-
35
-
36
-
37
-
38
-
39
-
40
-
41
-
42
-
43
-
44
-
45
-
46
-
47
-
48
-
49
-
50
-
51
-
52
-
53
-
54
-
55
-
56
-
57
-
58
-
59
-
60
-
61
-
62
-
63
-
64
-
65
-
66
-
67
-
68
-
69
-
70
-
71
-
72
-
73
-
74
-
75
-
76
-
77
-
78
-
79
-
80
-
81
-
82
-
83
-
84
-
85
-
86
-
87
-
88
-
89
-
90
-
91
-
92
-
93
-
94
-
95
-
96
-
97
-
98
-
99
-
100
-
101
-
102
-
103
-
104
-
105
-
106
-
107
-
108
-
109
-
110
-
111
-
112
-
113
-
114
-
115
-
116
-
117
-
118
-
119
-
120
-
121
-
122
-
123
-
124
-
 125
125 -
 126
126 -
 127
127 -
 128
128 -
 129
129 -
 130
130 -
 131
131 -
 132
132 -
 133
133 -
 134
134 -
 135
135 -
 136
136 -
 137
137 -
 138
138 -
 139
139 -
 140
140
 |
 |
133
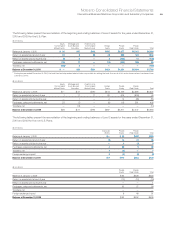
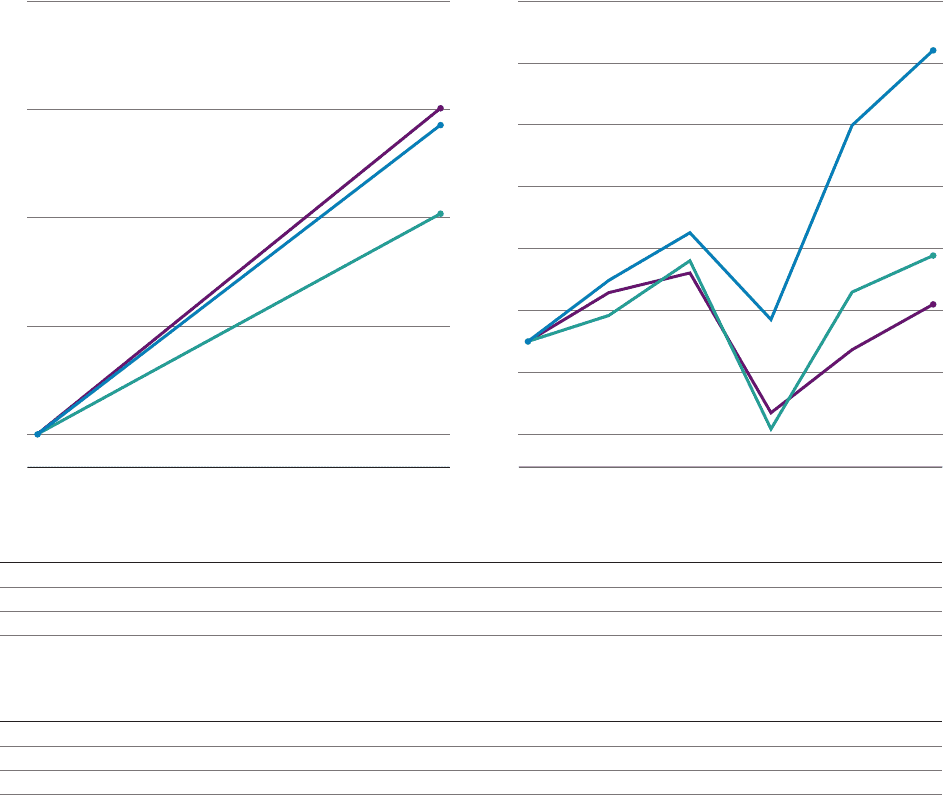
Performance Graphs
International Business Machines Corporation and Subsidiary Companies
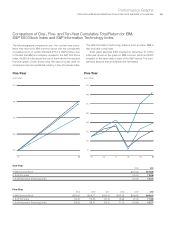
Comparison of One-, Five- and Ten-Year Cumulative Total Return for IBM,
S&P 500 Stock Index and S&P Information Technology Index
The following graphs compare the one-, five- and ten-year cumu-
lative total returns for IBM common stock with the comparable
cumulative return of certain Standard & Poor’s (S&P) indices. Due
to the fact that IBM is a company included in the S&P 500 Stock
Index, the SEC’s rules require the use of that index for the required
five-year graph. Under those rules, the second index used for
comparison may be a published industry or line-of-business index.
The S&P Information Technology Index is such an index. IBM is
also included in this index.
Each graph assumes $100 invested on December 31 (of the
initial year shown in the graph) in IBM common stock and $100
invested on the same date in each of the S&P indices. The com-
parisons assume that all dividends are reinvested.
One-Year
2009 2010
• IBM Common Stock $100.00 $114.28
• S & P 500 Index 100.00 115.06
• S & P Information Technology Index 100.00 110.19
Five-Year
2005 2006 2007 2008 2009 2010
• IBM Common Stock $100.00 $119.77 $135.15 $107.09 $169.85 $194.10
• S & P 500 Index 100.00 115.80 122.16 76.96 97.33 111.99
• S & P Information Technology Index 100.00 108.42 126.10 71.70 115.96 127.77
100
09 10
105
110
115
120
05 06 07 08 09 10
210
190
170
150
130
110
90
70
One-Year Five-Year
(U.S. Dollar) (U.S. Dollar)