IBM 2010 Annual Report Download - page 57
Download and view the complete annual report
Please find page 57 of the 2010 IBM annual report below. You can navigate through the pages in the report by either clicking on the pages listed below, or by using the keyword search tool below to find specific information within the annual report.-
 1
1 -
2
-
3
-
4
-
5
-
6
-
7
-
8
-
9
-
10
-
11
-
12
-
13
-
14
-
15
-
16
-
17
-
18
-
19
-
20
-
21
-
22
-
23
-
24
-
25
-
26
-
27
-
28
-
29
-
30
-
31
-
32
-
33
-
34
-
35
-
36
-
37
-
38
-
39
-
40
-
41
-
42
-
43
-
44
-
45
-
46
-
 47
47 -
 48
48 -
 49
49 -
 50
50 -
 51
51 -
 52
52 -
 53
53 -
 54
54 -
 55
55 -
 56
56 -
 57
57 -
 58
58 -
 59
59 -
 60
60 -
 61
61 -
 62
62 -
 63
63 -
 64
64 -
 65
65 -
 66
66 -
 67
67 -
68
-
69
-
70
-
71
-
72
-
73
-
74
-
75
-
76
-
77
-
78
-
79
-
80
-
81
-
82
-
83
-
84
-
85
-
86
-
87
-
88
-
89
-
90
-
91
-
92
-
93
-
94
-
95
-
96
-
97
-
98
-
99
-
100
-
101
-
102
-
103
-
104
-
105
-
106
-
107
-
108
-
109
-
110
-
111
-
112
-
113
-
114
-
115
-
116
-
117
-
118
-
119
-
120
-
121
-
122
-
123
-
124
-
125
-
126
-
127
-
128
-
129
-
130
-
131
-
132
-
133
-
134
-
135
-
136
-
137
-
138
-
139
-
140
 |
 |

55
Management Discussion
International Business Machines Corporation and Subsidiary Companies
Global Financing
Global Financing is a reportable segment that is measured as a
standalone entity.
In 2010, as the global economy continued to emerge from a
challenging credit environment, the Global Financing business
delivered strong financial results. The Global Financing business
continued to remain focused on its core competencies—providing
IT financing to the company’s clients and business partners. For
the year, Global Financing improved gross margin by 2.0 points
and pre-tax income margin by 5.6 points, while total revenue was
essentially flat year to year. Total pre-tax income of $1,959 million
increased 13.3 percent compared to 2009.
In addition to the overall health of the economy and its impact
on corporate IT budgets, key drivers of Global Financing’s results
are interest rates and originations. Interest rates directly impact
Global Financing’s business by increasing or decreasing both
financing revenue and the associated borrowing costs. Originations,
which determine the asset base of Global Financing’s annuity-like
business, are impacted by IBM’s non-Global Financing sales and
services volumes and Global Financing’s participation rates.
Participation rates are the propensity of IBM’s clients to finance
their transactions through Global Financing in lieu of paying IBM
up-front cash or financing through a third party.
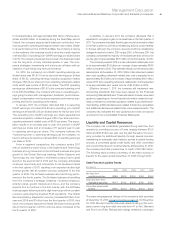
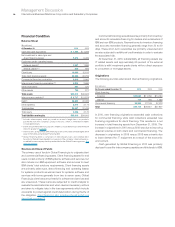
Results of Operations
($ in millions)
For the year ended December 31: 2010 2009 2008
External revenue $2,238 $2,302 $2,559
Internal revenue 1,842 1,774 1,892
Total revenue 4,080 4,076 4,451
Cost 1,474 1,555 1,887
Gross profit $2,606 $2,520 $2,564
Gross profit margin 63.9% 61.8% 57.6%
Pre-tax income $1,959 $1,730 $1,617
After-tax income* $1,295 $1,138 $1,049
Return on equity* 41.2% 34.4% 29.4%
* See page 59 for the details of the after-tax income and return on equity calculation.
Total revenue in 2010 increased $4 million versus 2009 as a result of:
• An increase in internal revenue of 3.8 percent driven by an
increase in used equipment sales revenue (up 7.0 percent to
$1,277 million), partially offset by a decrease in financing revenue
(down 2.6 percent to $565 million); offset by
•
A decline in external revenue of 2.8 percent (4 percent adjusted
for currency), due to a decrease in financing revenue (down
7.9 percent to $1,580 million), partially offset by an increase in
used equipment sales revenue (up 12.1 percent to $659 million).
The decreases in external and internal financing revenue were due
to lower average asset balances and lower asset yields.
Global Financing gross profit increased 3.4 percent compared
to 2009 primarily due to higher used equipment sales gross profit.
Gross margin increased 2.0 points primarily due to a higher
financing margin.
Total revenue in 2009 decreased $375 million compared to
2008 due to:
• A decline in external revenue of 10.0 percent (7 percent adjusted
for currency), due to decreases in financing revenue (down 11.6
percent to $1,715 million) and in used equipment sales (down
5.2 percent to $588 million); and
• A decline in internal revenue of 6.3 percent driven by a decrease
in financing revenue (down 22.0 percent to $580 million),
partially offset by an increase in used equipment sales (up 3.9
percent to $1,194 million).
The decreases in external and internal financing revenue were due
to lower average asset balances and lower asset yields.
Global Financing gross profit decreased 1.7 percent in 2009
versus 2008 due to lower revenue. Gross margin increased 4.2 points
due to higher margins on financing and used equipment sales.
Global Financing pre-tax income increased 13.3 percent in
2010 versus 2009, following an increase of 7.0 percent in 2009
versus 2008. The increase in 2010 was primarily driven by a
decrease in financing receivables provisions of $152 million and
the increase in gross profit of $85 million. The increase in 2009 was
primarily driven by decreases in financing receivables provisions
of $86 million and other SG&A expenses of $67 million, partially
offset by the decrease in gross profit of $44 million. The decrease
in financing receivables provisions in 2010 was primarily due to
lower specific reserve requirements and recoveries on previously
reserved accounts. The overall allowance for credit losses cover-
age rate was 1.5 percent, a decrease of 0.6 points versus 2009.
Excluding $2 million and $5 million of workforce rebalancing
charges in the first quarter of 2010 and 2009, respectively, pre-tax
income on a normalized basis increased 13.0 percent in 2010
versus the prior year. Pre-tax margins on a normalized basis were
48.1 percent and 42.6 percent for 2010 and 2009, respectively.
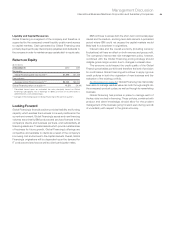
The increases in return on equity from 2009 to 2010 and from
2008 to 2009 were driven by higher after-tax income and a lower
average equity balance.