IBM 2010 Annual Report Download - page 37
Download and view the complete annual report
Please find page 37 of the 2010 IBM annual report below. You can navigate through the pages in the report by either clicking on the pages listed below, or by using the keyword search tool below to find specific information within the annual report.-
 1
1 -
2
-
3
-
4
-
5
-
6
-
7
-
8
-
9
-
10
-
11
-
12
-
13
-
14
-
15
-
16
-
17
-
18
-
19
-
20
-
21
-
22
-
23
-
24
-
25
-
26
-
 27
27 -
 28
28 -
 29
29 -
 30
30 -
 31
31 -
 32
32 -
 33
33 -
 34
34 -
 35
35 -
 36
36 -
 37
37 -
 38
38 -
 39
39 -
 40
40 -
 41
41 -
 42
42 -
 43
43 -
 44
44 -
 45
45 -
 46
46 -
 47
47 -
48
-
49
-
50
-
51
-
52
-
53
-
54
-
55
-
56
-
57
-
58
-
59
-
60
-
61
-
62
-
63
-
64
-
65
-
66
-
67
-
68
-
69
-
70
-
71
-
72
-
73
-
74
-
75
-
76
-
77
-
78
-
79
-
80
-
81
-
82
-
83
-
84
-
85
-
86
-
87
-
88
-
89
-
90
-
91
-
92
-
93
-
94
-
95
-
96
-
97
-
98
-
99
-
100
-
101
-
102
-
103
-
104
-
105
-
106
-
107
-
108
-
109
-
110
-
111
-
112
-
113
-
114
-
115
-
116
-
117
-
118
-
119
-
120
-
121
-
122
-
123
-
124
-
125
-
126
-
127
-
128
-
129
-
130
-
131
-
132
-
133
-
134
-
135
-
136
-
137
-
138
-
139
-
140
 |
 |

35
Management Discussion
International Business Machines Corporation and Subsidiary Companies
Current liabilities increased $4,560 million ($4,101 million adjusted
for currency) as a result of:
• An increase in short-term debt of $2,610 million ($2,441 million
adjusted for currency) primarily driven by:
– a net increase of $909 million in commercial paper and
$4,238 million in new debt issuances; and
– reclassification of $3,941 million from long-term to short-term
debt to reflect maturity dates; partially offset by
– $6,712 million in debt repayments.
•
An increase in deferred income of $735 million ($672 million
adjusted for currency) driven by the software business, includ-
ing acquisitions;
• An increase of $523 million in accrued compensation and
benefits; and
• An increase of $368 million in accounts payable, driven by
higher year-end activity.
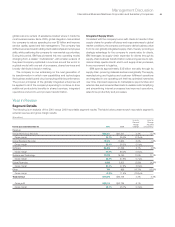
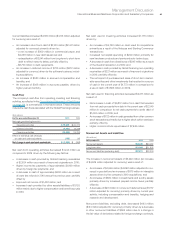
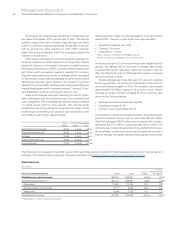
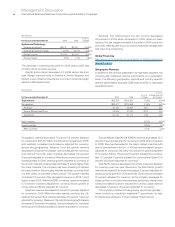
Cash Flow
The company’s cash flow from operating, investing and financing
activities, as reflected in the Consolidated Statement of Cash Flows
on page 64, is summarized in the table below. These amounts
include the cash flows associated with the Global Financing business.
($ in millions)
For the year ended December 31: 2010 2009
Net cash provided by/(used in):
Operating activities $ 19,549 $ 20,773
Investing activities (8,507) (6,729)
Financing activities (12,429) (14,700)
Effect of exchange rate changes
on cash and cash equivalents (135) 98
Net change in cash and cash equivalents $ (1,522) $ (558)
Net cash from operating activities decreased $1,224 million as
compared to 2009 driven by the following key factors:
• A decrease in cash provided by Global Financing receivables
of $2,634 million as a result of improved originations in 2010;
• Higher income tax payments of approximately $1,000 million
driven by foreign tax payments; and
• A decrease in cash of approximately $600 million as a result
of lower tax refunds in 2010 versus the previous year; partially
offset by
• Improved net income of $1,408 million; and
• Increased cash provided by other assets/liabilities of $1,125
million mainly due to higher compensation and benefit accruals
in 2010.
Net cash used in investing activities increased $1,778 million
driven by:
•
An increase of $4,728 million in cash used for acquisitions
primarily as a result of the Netezza and Sterling Commerce
transactions;
• Increased net capital spending of $299 million primarily for
new hardware products and semiconductor technology;
•
A decrease in cash from divestitures of $345 million as a result
of the Geodis transaction in 2009; and
•
A decrease in cash provided by Global Financing non-operating
receivables of $221 million as a result of improved originations
in 2010; partially offset by
• The net impact of purchases and sales of short-term market-
able securities and other investments that resulted in a source
of cash in the current year of $1,773 million in comparison to
a use of cash of $1,895 million in 2009.
Net cash used in financing activities decreased $2,271 million as
a result of:
• Net increase in cash of $9,812 million from debt that resulted
from net cash proceeds from debt in the current year of $2,349
million in comparison to net cash payments to settle debt of
$7,463 million in 2009; and
•
An increase of $722 million in cash generated from other common
stock transactions primarily due to higher stock option exercises;
partially offset by
• Higher common stock repurchases of $7,946 million.
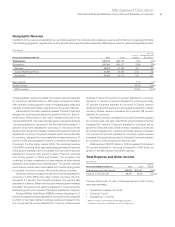
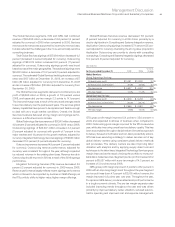
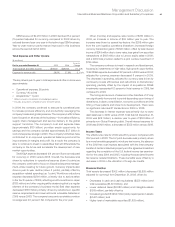
Noncurrent Assets and Liabilities
($ in millions)
At December 31: 2010 2009
Noncurrent assets $65,335 $60,087
Long-term debt $21,846 $21,932
Noncurrent liabilities (excluding debt) $27,871 $28,334
The increase in noncurrent assets of $5,249 million (an increase
of $4,609 million adjusted for currency) was a result of:
• An increase of $4,946 million ($4,698 million adjusted for cur-
rency) in goodwill and an increase of $975 million in intangible
assets driven by the company’s 2010 acquisitions; and
• An increase of $399 million in investments and sundry assets
primarily driven by increased prepaid income taxes; partially
offset by
•
A decrease of $974 million in noncurrent deferred taxes ($1,137
million adjusted for currency) primarily driven by current year
activity, including compensation and benefits, hedging and
research and development.
Noncurrent liabilities, excluding debt, decreased $463 million
($414 million adjusted for currency) primarily driven by a decrease
in other noncurrent liabilities of $592 million due to a change in
the fair value of derivatives related to foreign exchange contracts.