IBM 2010 Annual Report Download - page 40
Download and view the complete annual report
Please find page 40 of the 2010 IBM annual report below. You can navigate through the pages in the report by either clicking on the pages listed below, or by using the keyword search tool below to find specific information within the annual report.-
 1
1 -
2
-
3
-
4
-
5
-
6
-
7
-
8
-
9
-
10
-
11
-
12
-
13
-
14
-
15
-
16
-
17
-
18
-
19
-
20
-
21
-
22
-
23
-
24
-
25
-
26
-
27
-
28
-
29
-
 30
30 -
 31
31 -
 32
32 -
 33
33 -
 34
34 -
 35
35 -
 36
36 -
 37
37 -
 38
38 -
 39
39 -
 40
40 -
 41
41 -
 42
42 -
 43
43 -
 44
44 -
 45
45 -
 46
46 -
 47
47 -
 48
48 -
 49
49 -
 50
50 -
51
-
52
-
53
-
54
-
55
-
56
-
57
-
58
-
59
-
60
-
61
-
62
-
63
-
64
-
65
-
66
-
67
-
68
-
69
-
70
-
71
-
72
-
73
-
74
-
75
-
76
-
77
-
78
-
79
-
80
-
81
-
82
-
83
-
84
-
85
-
86
-
87
-
88
-
89
-
90
-
91
-
92
-
93
-
94
-
95
-
96
-
97
-
98
-
99
-
100
-
101
-
102
-
103
-
104
-
105
-
106
-
107
-
108
-
109
-
110
-
111
-
112
-
113
-
114
-
115
-
116
-
117
-
118
-
119
-
120
-
121
-
122
-
123
-
124
-
125
-
126
-
127
-
128
-
129
-
130
-
131
-
132
-
133
-
134
-
135
-
136
-
137
-
138
-
139
-
140
 |
 |
38
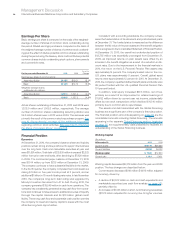
Management Discussion
International Business Machines Corporation and Subsidiary Companies
the acquisition of Netezza, the value of business analytics can be
extended to both large enterprises and smaller clients with a system
that is simple, economical and offers quick time-to-value. Netezza
got off to a strong start in the quarter and complements the
company’s business analytics and optimization capabilities.
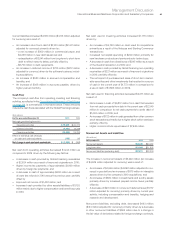
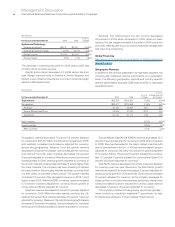
The fourth quarter concluded a strong year for the software
segment. Software gross profit increased 0.9 points to 88.5 percent.
The Software segment delivered pre-tax profit of $3,172 million,
an increase of 3.7 percent with a pre-tax margin of 40.6 percent.
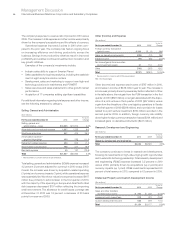
Systems and Technology revenue of $6,277 million increased
21.0 percent (22 percent adjusted for currency), the best quarterly
revenue performance in over a decade. Revenue was driven by
growth in all brands with strong double-digit growth in System z,
Power Systems entry systems, System x, Storage disk products,
Retail Store Solutions and Microelectronics OEM. Both the major
markets and growth markets had revenue growth in excess of 20
percent in the quarter. Total servers gained 3 points of market
share with each of the server brands gaining share while Storage
held share. System z revenue increased 69.2 percent (72 percent
adjusted for currency). This performance reflects the value and
innovation System z delivers to clients. System z MIPS shipments
increased 58 percent year to year. The fourth-quarter MIPS per-
formance was the highest quarterly growth in six years. Power
Systems revenue increased 1.8 percent (3 percent adjusted for
currency) and gained share for the 11th consecutive quarter. This
was the first quarter with the complete POWER7 product line avail-
able. The newly introduced entry systems had strong customer
acceptance with revenue growth of 29.9 percent (31 percent
adjusted for currency) year to year. Mid-range Power Systems
revenue grew 6.7 percent (8 percent adjusted for currency), the
third consecutive quarter of revenue growth. The high-end prod-
uct set has strong momentum entering 2011 as it shipped nearly
200 high-end 795 servers in the fourth quarter of 2010, three times
as many as the third quarter of 2010. The company’s competitive
take outs continued in the fourth quarter, with over 280 displace-
ments driving approximately $325 million of business. Storage
revenue increased 8.3 percent (10 percent adjusted for currency)
led by the growth markets which increased 23 percent adjusted
for currency, the third consecutive quarter of growth above 20
percent. Total disk revenue increased 10.9 percent (13 percent
adjusted for currency) driven by the continued strength in high-end
storage, XIV and the DS8000 product. XIV added more than 200
new customers to its platform in the fourth quarter. Storage had
a successful launch of its new V7000 mid-range product which
was sold out in the fourth quarter. System x revenue increased
18.3 percent (18 percent adjusted for currency), the fifth consecu-
tive quarter of double-digit revenue growth. High-end System x
revenue increased 31.0 percent (31 percent adjusted for currency)
and System x blades revenue grew 14.1 percent (14 percent
adjusted for currency). Retail Stores Solutions revenue increased
25.6 percent (27 percent adjusted for currency) and extended the
company’s leadership position as a point of sale provider.
Microelectronics OEM revenue increased 29.6 percent (30 percent
adjusted for currency) in the fourth quarter with strong growth from
networking and game console products.
Systems and Technology gross margin of 43.9 percent
increased 1.4 points versus the fourth quarter of 2009 primarily
reflecting a richer revenue mix to System z. The Systems and
Technology segment pre-tax profit increased 45.1 percent to
$1,208 million. Pre-tax margin increased 3.2 points to 18.6 percent
compared to the fourth quarter of 2009.
Global Financing revenue of $628 million increased 1.2 percent
(1 percent adjusted for currency), driven primarily by an increase
in used equipment sales revenue. The Global Financing segment
fourth-quarter pre-tax profit increased 14.0 percent to $567 million
and the pre-tax margin expanded 3.4 points to 47.1 percent from
the fourth quarter of 2009. The company’s financing business
delivered good results as the global economy continued to emerge
from a challenging credit environment.
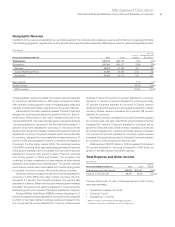
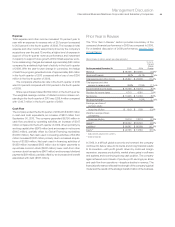
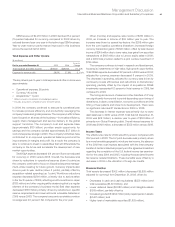
Geographic Revenue
Total geographic revenue of $28,234 million increased 6.2 percent
(7 percent adjusted for currency) year to year in the fourth quarter
with constant currency growth in all geographies. Revenue from
the major markets increased 3.9 percent (5 percent adjusted
for currency) and improved 5 points from the constant currency
performance in the third quarter. The fourth-quarter revenue
growth was driven by the U.S., France and Italy. The U.S.—the
company’s largest market—grew 10 percent, representing the
strongest year-to-year growth in 11 years. Revenue from the growth
markets increased 15.4 percent (13 percent adjusted for currency);
adjusted for currency, revenue growth outpaced the major markets
by 8 points in the quarter. In the BRIC countries, which represented
approximately 41 percent of the growth markets revenue in the
quarter, revenue increased 18.7 percent (17 percent adjusted for
currency) with growth in each of the four countries led by strong
growth in China (up 27.0 percent, 25 percent adjusted for currency)
and Russia (up 45.2 percent, 46 percent adjusted for currency).
Revenue growth in the growth markets continues to be broad
based with double-digit growth in 50 countries, adjusted for
currency, up from 32 countries in the third quarter of 2010. In the
fourth quarter, the company gained share overall in the growth
markets as well as in hardware and software. Total Americas
revenue of $12,151 million increased 9.4 percent (9 percent adjusted
for currency). EMEA revenue decreased 1.8 percent (increased
4 percent adjusted for currency) to $9,516 million. Adjusted for
currency, revenue performance was led by France with strong
double-digit growth (7.3 percent, 17 percent adjusted for currency)
and solid performance in Italy (declined 3.9 percent, increased
5 percent adjusted for currency). Revenue performance was mixed
across the other major market countries with the U.K. down
1.5 percent (up 2 percent adjusted for currency), Germany down
10.7 percent (3 percent adjusted for currency) and Spain down 6.2
percent (up 2 percent adjusted for currency). Asia Pacific revenue
increased 13.6 percent (7 percent adjusted for currency) to $6,567
million, with the growth markets up 19.7 percent (14 percent
adjusted for currency) and Japan up 6.5 percent (decreased
2 percent adjusted for currency).