IBM 2010 Annual Report Download - page 13
Download and view the complete annual report
Please find page 13 of the 2010 IBM annual report below. You can navigate through the pages in the report by either clicking on the pages listed below, or by using the keyword search tool below to find specific information within the annual report.-
 1
1 -
2
-
 3
3 -
 4
4 -
 5
5 -
 6
6 -
 7
7 -
 8
8 -
 9
9 -
 10
10 -
 11
11 -
 12
12 -
 13
13 -
 14
14 -
 15
15 -
 16
16 -
 17
17 -
 18
18 -
 19
19 -
 20
20 -
 21
21 -
 22
22 -
 23
23 -
24
-
25
-
26
-
27
-
28
-
29
-
30
-
31
-
32
-
33
-
34
-
35
-
36
-
37
-
38
-
39
-
40
-
41
-
42
-
43
-
44
-
45
-
46
-
47
-
48
-
49
-
50
-
51
-
52
-
53
-
54
-
55
-
56
-
57
-
58
-
59
-
60
-
61
-
62
-
63
-
64
-
65
-
66
-
67
-
68
-
69
-
70
-
71
-
72
-
73
-
74
-
75
-
76
-
77
-
78
-
79
-
80
-
81
-
82
-
83
-
84
-
85
-
86
-
87
-
88
-
89
-
90
-
91
-
92
-
93
-
94
-
95
-
96
-
97
-
98
-
99
-
100
-
101
-
102
-
103
-
104
-
105
-
106
-
107
-
108
-
109
-
110
-
111
-
112
-
113
-
114
-
115
-
116
-
117
-
118
-
119
-
120
-
121
-
122
-
123
-
124
-
125
-
126
-
127
-
128
-
129
-
130
-
131
-
132
-
133
-
134
-
135
-
136
-
137
-
138
-
139
-
140
 |
 |
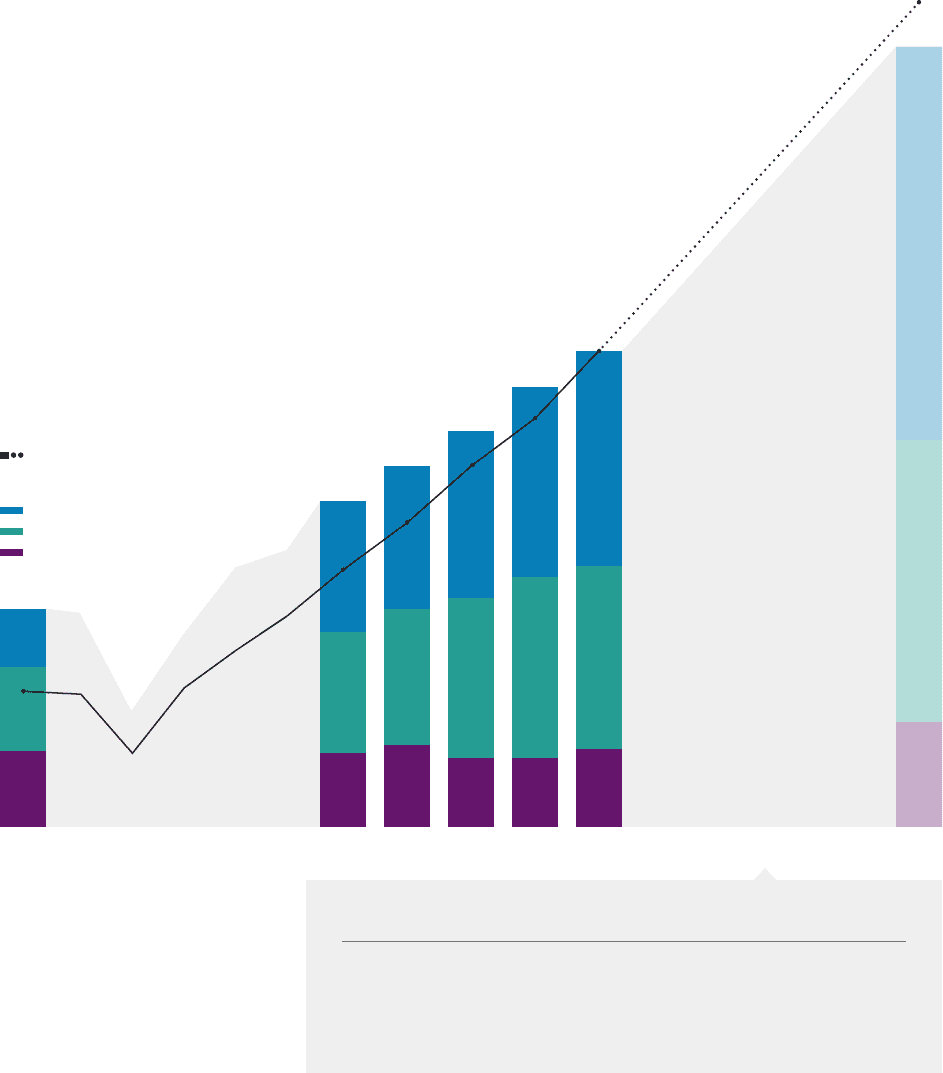
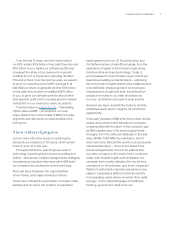
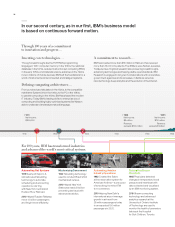
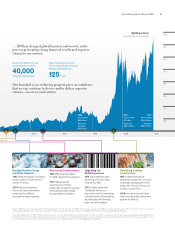
2000 2006 2007 2008 2009 2010 2015
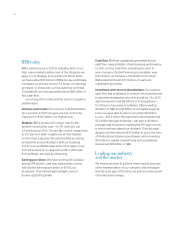
Key Drivers for 2015 EPS Road Map
Revenue Growth
A combination of base
revenue growth, a shift to
faster growing businesses
and strategic acquisitions.
Operating Leverage
A shift to higher-margin businesses
and enterprise productivity
derived from global integration
and process efficiencies.
Share Repurchase
Leveraging our strong cash
generation to return value
to shareholders by reducing
shares outstanding.
* Excludes acquisition-related and nonoperating
retirement-related charges.
** 2000 and 2001 exclude Enterprise Investments
and not restated for stock-based compensation.
Sum of external segment pre-tax income not equal
to IBM pre-tax income.
At Least $20
Operating EPS*
Segment Operating Pre-Tax Income*, **
Software
Services
Hardware/Financing
Operating EPS*
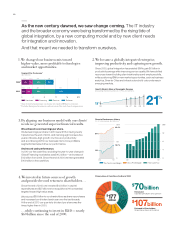
5. Today, we run a business model that delivers
long-term value and high performance.
Early in 2007, we established our earnings per share road map
to 2010. It provided clarity about our business model, objectives
and key factors driving performance. The road map also aligned
all IBMers against a set of long-term objectives.
We achieved $11.52 of EPS in 2010, well above the high
end of the range of $10 to $11 during one of the toughest
economic environments in decades.
This resulted in superior returns to investors over the
road map period.
Now, our 2015 Road Map continues the drive to higher
value—with the expectation of at least $20 operating EPS
in five years (non-GAAP).*
Key objectives over the next five years:
• $100 billion in free cash flow
• $70 billion of capital returned
to shareholders
• $20 billion in spending
on acquisitions
• Software becomes about
half of segment profit
• Growth markets
approach 30 percent of
geographic revenue
11Generating Higher Value at IBM