IBM 2010 Annual Report Download - page 60
Download and view the complete annual report
Please find page 60 of the 2010 IBM annual report below. You can navigate through the pages in the report by either clicking on the pages listed below, or by using the keyword search tool below to find specific information within the annual report.-
 1
1 -
2
-
3
-
4
-
5
-
6
-
7
-
8
-
9
-
10
-
11
-
12
-
13
-
14
-
15
-
16
-
17
-
18
-
19
-
20
-
21
-
22
-
23
-
24
-
25
-
26
-
27
-
28
-
29
-
30
-
31
-
32
-
33
-
34
-
35
-
36
-
37
-
38
-
39
-
40
-
41
-
42
-
43
-
44
-
45
-
46
-
47
-
48
-
49
-
 50
50 -
 51
51 -
 52
52 -
 53
53 -
 54
54 -
 55
55 -
 56
56 -
 57
57 -
 58
58 -
 59
59 -
 60
60 -
 61
61 -
 62
62 -
 63
63 -
 64
64 -
 65
65 -
 66
66 -
 67
67 -
 68
68 -
 69
69 -
 70
70 -
71
-
72
-
73
-
74
-
75
-
76
-
77
-
78
-
79
-
80
-
81
-
82
-
83
-
84
-
85
-
86
-
87
-
88
-
89
-
90
-
91
-
92
-
93
-
94
-
95
-
96
-
97
-
98
-
99
-
100
-
101
-
102
-
103
-
104
-
105
-
106
-
107
-
108
-
109
-
110
-
111
-
112
-
113
-
114
-
115
-
116
-
117
-
118
-
119
-
120
-
121
-
122
-
123
-
124
-
125
-
126
-
127
-
128
-
129
-
130
-
131
-
132
-
133
-
134
-
135
-
136
-
137
-
138
-
139
-
140
 |
 |

58
Management Discussion
International Business Machines Corporation and Subsidiary Companies
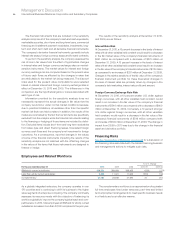
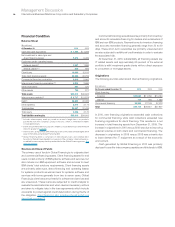
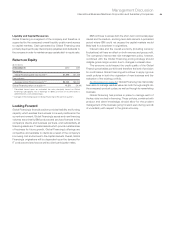
Debt
At December 31: 2010 2009
Debt-to-equity ratio 7.0x 7.1x
The company funds Global Financing through borrowings using
a debt-to-equity ratio target of approximately 7 to 1. The debt used
to fund Global Financing assets is composed of intercompany
loans and external debt. The terms of the intercompany loans are
set by the company to substantially match the term and currency
underlying the financing receivable and are based on arm’s-length
pricing. Both assets and debt are presented in the “Global
Financing Balance Sheet” on page 56.
Global Financing provides financing predominantly for the
company’s external client assets, as well as for assets under
contract by other IBM units. As previously stated, the company
measures Global Financing as a standalone entity, and accordingly,
interest expense relating to debt supporting Global Financing’s
external client and internal business is included in the “Global
Financing Results of Operations” on page 55 and in note V,
“Segment Information,” on pages 126 to 130.
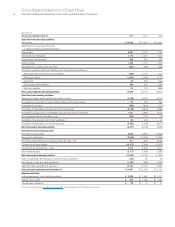
In the company’s Consolidated Statement of Earnings on page
62, however, the external debt-related interest expense supporting
Global Financing’s internal financing to the company is reclassified
from cost of financing to interest expense.
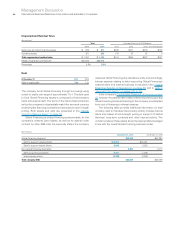
The following table provides additional information on total
company debt. In this table, intercompany activity includes internal
loans and leases at arm’s-length pricing in support of Global
Services’ long-term contracts and other internal activity. The
company believes these assets should be appropriately leveraged
in line with the overall Global Financing business model.
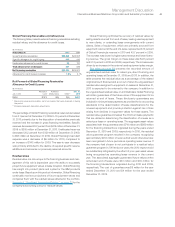
Unguaranteed Residual Value
($ in millions)
Tot a l Estimated Run Out of 2010 Balance
2009 2010 2011 2012 2013 2014 and Beyond
Sales-type and direct financing leases $ 849 $ 871 $260 $277 $205 $128
Operating leases 351 328 154 83 82 9
Total unguaranteed residual value $ 1,200 $ 1,199 $414 $360 $287 $137
Related original amount financed $20,526 $20,412
Percentage 5.8% 5.9%
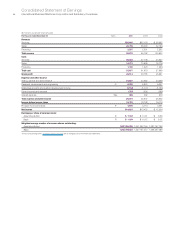
($ in millions)
December 31, 2010 December 31, 2009
Global Financing Segment: $22,823 $22,383
Debt to support external clients $19,583 $19,091
Debt to support internal clients 3,240 3,292
Non-Global Financing Segments: 5,801 3,717
Debt supporting operations 9,041 7,008
Intercompany activity (3,240) (3,292)
Total company debt $28,624 $26,099