IBM 2010 Annual Report Download - page 56
Download and view the complete annual report
Please find page 56 of the 2010 IBM annual report below. You can navigate through the pages in the report by either clicking on the pages listed below, or by using the keyword search tool below to find specific information within the annual report.-
 1
1 -
2
-
3
-
4
-
5
-
6
-
7
-
8
-
9
-
10
-
11
-
12
-
13
-
14
-
15
-
16
-
17
-
18
-
19
-
20
-
21
-
22
-
23
-
24
-
25
-
26
-
27
-
28
-
29
-
30
-
31
-
32
-
33
-
34
-
35
-
36
-
37
-
38
-
39
-
40
-
41
-
42
-
43
-
44
-
45
-
 46
46 -
 47
47 -
 48
48 -
 49
49 -
 50
50 -
 51
51 -
 52
52 -
 53
53 -
 54
54 -
 55
55 -
 56
56 -
 57
57 -
 58
58 -
 59
59 -
 60
60 -
 61
61 -
 62
62 -
 63
63 -
 64
64 -
 65
65 -
 66
66 -
67
-
68
-
69
-
70
-
71
-
72
-
73
-
74
-
75
-
76
-
77
-
78
-
79
-
80
-
81
-
82
-
83
-
84
-
85
-
86
-
87
-
88
-
89
-
90
-
91
-
92
-
93
-
94
-
95
-
96
-
97
-
98
-
99
-
100
-
101
-
102
-
103
-
104
-
105
-
106
-
107
-
108
-
109
-
110
-
111
-
112
-
113
-
114
-
115
-
116
-
117
-
118
-
119
-
120
-
121
-
122
-
123
-
124
-
125
-
126
-
127
-
128
-
129
-
130
-
131
-
132
-
133
-
134
-
135
-
136
-
137
-
138
-
139
-
140
 |
 |

54
Management Discussion
International Business Machines Corporation and Subsidiary Companies
The financial instruments that are included in the sensitivity
analysis comprise all of the company’s cash and cash equivalents,
marketable securities, short-term and long-term loans, commercial
financing and installment payment receivables, investments, long-
term and short-term debt and all derivative financial instruments.
The company’s derivative financial instruments generally include
interest rate swaps, foreign currency swaps and forward contracts.
To perform the sensitivity analysis, the company assesses the
risk of loss in fair values from the effect of hypothetical changes
in interest rates and foreign currency exchange rates on market-
sensitive instruments. The market values for interest and foreign
currency exchange risk are computed based on the present value
of future cash flows as affected by the changes in rates that
are attributable to the market risk being measured. The discount
rates used for the present value computations were selected
based on market interest and foreign currency exchange rates in
effect at December 31, 2010 and 2009. The differences in this
comparison are the hypothetical gains or losses associated with
each type of risk.
Information provided by the sensitivity analysis does not
necessarily represent the actual changes in fair value that the
company would incur under normal market conditions because,
due to practical limitations, all variables other than the specific
market risk factor are held constant. In addition, the results of the
model are constrained by the fact that certain items are specifically
excluded from the analysis, while the financial instruments relating
to the financing or hedging of those items are included by defini-
tion. Excluded items include short-term and long-term receivables
from sales-type and direct financing leases, forecasted foreign
currency cash flows and the company’s net investment in foreign
operations. As a consequence, reported changes in the values
of some of the financial instruments impacting the results of the
sensitivity analysis are not matched with the offsetting changes
in the values of the items that those instruments are designed to
finance or hedge.
As a globally integrated enterprise, the company operates in over
170 countries and is continuing to shift its business to the higher
value segments of enterprise computing. The company continually
assesses its resource needs with the objective of balancing its
workforce globally to improve the company’s global reach and com-
petitiveness. In 2010, total employees at IBM and its wholly owned
subsidiaries increased more than 27,000 compared to the prior year.
The results of the sensitivity analysis at December 31, 2010,
and 2009, are as follows:
Interest Rate Risk
At December 31, 2010, a 10 percent decrease in the levels of interest
rates with all other variables held constant would result in a decrease
in the fair market value of the company’s financial instruments of
$341 million as compared with a decrease of $274 million at
December 31, 2009. A 10 percent increase in the levels of interest
rates with all other variables held constant would result in an increase
in the fair value of the company’s financial instruments of $315 million
as compared to an increase of $251 million at December 31, 2009.
Changes in the relative sensitivity of the fair value of the company’s
financial instrument portfolio for these theoretical changes in
the level of interest rates are primarily driven by changes in the
company’s debt maturities, interest rate profile and amount.
Foreign Currency Exchange Rate Risk
At December 31, 2010, a 10 percent weaker U.S. dollar against
foreign currencies, with all other variables held constant, would
result in an increase in the fair value of the company’s financial
instruments of $546 million as compared with a decrease of $609
million at December 31, 2009. Conversely, a 10 percent stronger
U.S. dollar against foreign currencies, with all other variables
held constant, would result in a decrease in the fair value of the
company’s financial instruments of $546 million compared with
an increase of $609 million at December 31, 2009. The change in
impact from 2009 to 2010 was due to the change in the financial
asset and derivative portfolio.
Financing Risks
See the “Description of Business” on page 23 for a discussion of
the financing risks associated with the Global Financing business
and management’s actions to mitigate such risks.
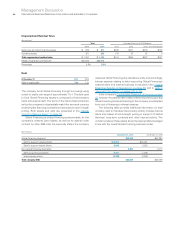
The complementary workforce is an approximation of equivalent
full-time employees hired under temporary, part-time and limited
term employment arrangements to meet specific business needs
in a flexible and cost-effective manner.
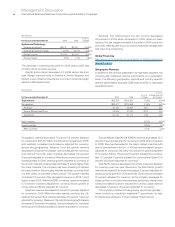
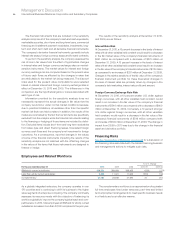
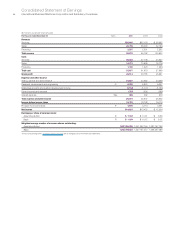
Employees and Related Workforce
Yr.-to-Yr. Change
For the year ended December 31: 2010 2009 2008 2010-09 2009-08
IBM/wholly owned subsidiaries 426,751 399,409 398,455 6.8% 0.2%
Less-than-wholly owned subsidiaries 9,334 11,421 11,642 (18.3) (1.9)
Complementary 27,784 26,946 27,983 3.1 (3.7)