IBM 2010 Annual Report Download - page 132
Download and view the complete annual report
Please find page 132 of the 2010 IBM annual report below. You can navigate through the pages in the report by either clicking on the pages listed below, or by using the keyword search tool below to find specific information within the annual report.-
 1
1 -
2
-
3
-
4
-
5
-
6
-
7
-
8
-
9
-
10
-
11
-
12
-
13
-
14
-
15
-
16
-
17
-
18
-
19
-
20
-
21
-
22
-
23
-
24
-
25
-
26
-
27
-
28
-
29
-
30
-
31
-
32
-
33
-
34
-
35
-
36
-
37
-
38
-
39
-
40
-
41
-
42
-
43
-
44
-
45
-
46
-
47
-
48
-
49
-
50
-
51
-
52
-
53
-
54
-
55
-
56
-
57
-
58
-
59
-
60
-
61
-
62
-
63
-
64
-
65
-
66
-
67
-
68
-
69
-
70
-
71
-
72
-
73
-
74
-
75
-
76
-
77
-
78
-
79
-
80
-
81
-
82
-
83
-
84
-
85
-
86
-
87
-
88
-
89
-
90
-
91
-
92
-
93
-
94
-
95
-
96
-
97
-
98
-
99
-
100
-
101
-
102
-
103
-
104
-
105
-
106
-
107
-
108
-
109
-
110
-
111
-
112
-
113
-
114
-
115
-
116
-
117
-
118
-
119
-
120
-
121
-
 122
122 -
 123
123 -
 124
124 -
 125
125 -
 126
126 -
 127
127 -
 128
128 -
 129
129 -
 130
130 -
 131
131 -
 132
132 -
 133
133 -
 134
134 -
 135
135 -
 136
136 -
 137
137 -
 138
138 -
 139
139 -
 140
140
 |
 |

Notes to Consolidated Financial Statements
International Business Machines Corporation and Subsidiary Companies130
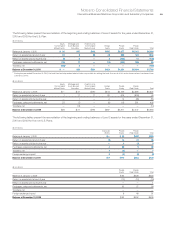
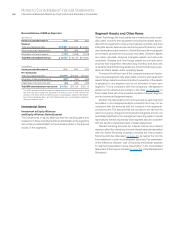
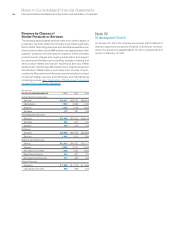
Revenue by Classes of
Similar Products or Services
The following table presents external revenue for similar classes of
products or services within the company’s reportable segments.
Within Global Technology Services and Global Business Services,
client solutions often include IBM software and systems and other
suppliers’ products if the client solution requires it. Within Software,
product license charges and ongoing subscription and support
are reported as Software and consulting, education, training and
other product-related services are reported as Services. Within
Systems and Technology, Microelectronics original equipment
manufacturer (OEM) revenue is primarily from the sale of semi-
conductors. Microelectronics Services revenue includes circuit and
component design services and technology and manufacturing
consulting services. See “Description of the Business” beginning
on page 20 for additional information.
($ in millions)
For the year ended December 31: 2010 2009 2008
Global Technology Services:
Services $29,367 $28,762 $29,928
Maintenance 7,250 6,956 7,250
Systems 1,409 1,279 1,648
Software 175 351 438
Global Business Services:
Services $17,858 $17,213 $19,176
Software 236 231 237
Systems 129 208 215
Software:
Software $20,882 $20,094 $20,695
Services 1,603 1,302 1,394
Systems and Technology:
Servers $11,619 $10,627 $12,717
Storage 3,420 3,177 3,612
Microelectronics OEM 1,938 1,550 1,862
Retail Store Solutions 674 551 741
Microelectronics Services 321 285 355
Global Financing:
Financing $ 1,580 $ 1,715 $ 1,946
Used equipment sales 659 588 613
Note W.
Subsequent Event
On January 25, 2011, the company announced that the Board of
Directors approved a quarterly dividend of $0.65 per common
share. The dividend is payable March 10, 2011 to shareholders of
record on February 10, 2011.