IBM 2010 Annual Report Download - page 42
Download and view the complete annual report
Please find page 42 of the 2010 IBM annual report below. You can navigate through the pages in the report by either clicking on the pages listed below, or by using the keyword search tool below to find specific information within the annual report.-
 1
1 -
2
-
3
-
4
-
5
-
6
-
7
-
8
-
9
-
10
-
11
-
12
-
13
-
14
-
15
-
16
-
17
-
18
-
19
-
20
-
21
-
22
-
23
-
24
-
25
-
26
-
27
-
28
-
29
-
30
-
31
-
 32
32 -
 33
33 -
 34
34 -
 35
35 -
 36
36 -
 37
37 -
 38
38 -
 39
39 -
 40
40 -
 41
41 -
 42
42 -
 43
43 -
 44
44 -
 45
45 -
 46
46 -
 47
47 -
 48
48 -
 49
49 -
 50
50 -
 51
51 -
 52
52 -
53
-
54
-
55
-
56
-
57
-
58
-
59
-
60
-
61
-
62
-
63
-
64
-
65
-
66
-
67
-
68
-
69
-
70
-
71
-
72
-
73
-
74
-
75
-
76
-
77
-
78
-
79
-
80
-
81
-
82
-
83
-
84
-
85
-
86
-
87
-
88
-
89
-
90
-
91
-
92
-
93
-
94
-
95
-
96
-
97
-
98
-
99
-
100
-
101
-
102
-
103
-
104
-
105
-
106
-
107
-
108
-
109
-
110
-
111
-
112
-
113
-
114
-
115
-
116
-
117
-
118
-
119
-
120
-
121
-
122
-
123
-
124
-
125
-
126
-
127
-
128
-
129
-
130
-
131
-
132
-
133
-
134
-
135
-
136
-
137
-
138
-
139
-
140
 |
 |

40
Management Discussion
International Business Machines Corporation and Subsidiary Companies
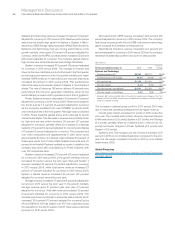
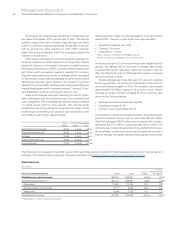
For the year, the company delivered $10.01 in diluted earnings
per share, an increase of 12.6 percent year to year. This was the
seventh consecutive year of double-digit earnings per share
growth. In 2007, the company developed a Road Map for growth
with an earnings per share objective for 2010 of $10 to $11 per
share. With its performance in 2009, the company achieved this
objective one year early.
Total revenue decreased 7.6 percent (5 percent adjusted for
currency) compared to 2008. Revenue from the growth markets
declined 3.5 percent, but increased 1 percent at constant currency.
Performance was led by the BRIC countries of Brazil, Russia, India
and China which increased 4 percent, adjusted for currency.
Segment performance was driven by Software which decreased
3.1 percent year to year (1 percent adjusted for currency) and Global
Technology Services which declined 4.9 percent (2 percent
adjusted for currency). Within Software, performance was led by key
branded middleware which increased revenue 1.1 percent (3 per-
cent adjusted for currency) compared to the prior year.
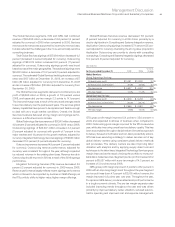
Gross profit margins improved reflecting the shift to higher
value businesses and the continued focus on productivity and
cost management. The consolidated gross profit margin increased
1.7 points versus 2008 to 45.7 percent. This was the sixth
consecutive year of improvement in the gross profit margin. Gross
profit margin performance by segment and the impact to the
consolidated gross margin was as follows:
Gross Yr.-to-Yr. Consolidated
Margin Change Impact
Global Technology Services 35.0% 2.4 pts. 0.8 pts.
Global Business Services 28.2% 1.5 pts. 0.4 pts.
Software 86.0% 0.6 pts. 0.6 pts.
Systems and Technology 37.8% (0.2) pts. 0.1 pts.
Global Financing 47.5% (3.8) pts. (0.1) pts.
Total expense and other income decreased 11.4 percent in 2009
versus 2008. The year-to-year drivers were approximately:
• Operational expense, (9) points
• Currency,* (4) points
• Acquisitions,** 1 point
* Reflects impacts of translation and hedging programs.
** Includes acquisitions completed in prior 12-month period.
Pre-tax income grew 8.5 percent and the pre-tax margin was 18.9
percent, the highest level in more than a decade. Net income
increased 8.8 percent reflecting a slight improvement in the tax
rate. The effective tax rate for 2009 was 26.0 percent, compared
with 26.2 percent in 2008.
Diluted earnings per share improved 12.6 percent reflecting
the strong growth in net income and the benefits of the common
stock repurchase program. In 2009, the company repurchased
approximately 69 million shares of its common stock. Diluted
earnings per share of $10.01 increased $1.12 from the prior year
driven by the following factors:
• Revenue decrease at actual rates, $(0.68)
• Operating leverage, $ 1.46
• Common stock repurchases, $ 0.34
At December 31, 2009, the company’s balance sheet and liquidity
positions remained strong. Cash on hand was $12,183 million.
Total debt decreased $7,826 million year to year, and the company
generated $20,773 million in operating cash flow in 2009. The
company has consistently generated strong cash flow from oper-
ations and also continues to have access to additional sources of
liquidity through the capital markets and its global credit facility.
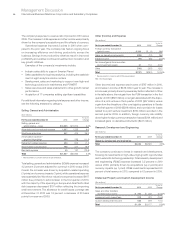
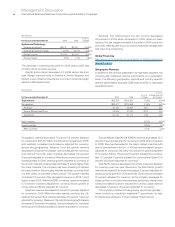
The following is an analysis of the 2009 versus 2008 reportable segment results for Global Services, Systems and Technology and
Software. The Global Financing segment analysis is included in the Global Financing section on pages 55 through 59.
Global Services
($ in millions)
Yr.-to-Yr.
Yr.-to-Yr. Change Adjusted
For the year ended December 31: 2009* 2008* Change for Currency
Global Services external revenue: $55,000 $58,891 (6.6)% (4.0)%
Global Technology Services: $37,347 $39,264 (4.9)% (2.0)%
Outsourcing 21,620 22,734 (4.9) (2.0)
Integrated Technology Services 8,771 9,283 (5.5) (2.9)
Maintenance 6,956 7,250 (4.1) (1.1)
Global Business Services $17,653 $19,628 (10.1)% (8.1)%
* Reclassified to conform with 2010 presentation.