IBM 2010 Annual Report Download - page 67
Download and view the complete annual report
Please find page 67 of the 2010 IBM annual report below. You can navigate through the pages in the report by either clicking on the pages listed below, or by using the keyword search tool below to find specific information within the annual report.-
 1
1 -
2
-
3
-
4
-
5
-
6
-
7
-
8
-
9
-
10
-
11
-
12
-
13
-
14
-
15
-
16
-
17
-
18
-
19
-
20
-
21
-
22
-
23
-
24
-
25
-
26
-
27
-
28
-
29
-
30
-
31
-
32
-
33
-
34
-
35
-
36
-
37
-
38
-
39
-
40
-
41
-
42
-
43
-
44
-
45
-
46
-
47
-
48
-
49
-
50
-
51
-
52
-
53
-
54
-
55
-
56
-
 57
57 -
 58
58 -
 59
59 -
 60
60 -
 61
61 -
 62
62 -
 63
63 -
 64
64 -
 65
65 -
 66
66 -
 67
67 -
 68
68 -
 69
69 -
 70
70 -
 71
71 -
 72
72 -
 73
73 -
 74
74 -
 75
75 -
 76
76 -
 77
77 -
78
-
79
-
80
-
81
-
82
-
83
-
84
-
85
-
86
-
87
-
88
-
89
-
90
-
91
-
92
-
93
-
94
-
95
-
96
-
97
-
98
-
99
-
100
-
101
-
102
-
103
-
104
-
105
-
106
-
107
-
108
-
109
-
110
-
111
-
112
-
113
-
114
-
115
-
116
-
117
-
118
-
119
-
120
-
121
-
122
-
123
-
124
-
125
-
126
-
127
-
128
-
129
-
130
-
131
-
132
-
133
-
134
-
135
-
136
-
137
-
138
-
139
-
140
 |
 |

65
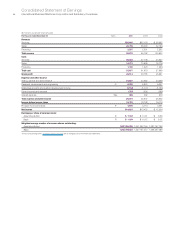
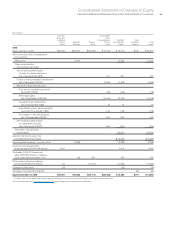
Consolidated Statement of Changes in Equity
International Business Machines Corporation and Subsidiary Companies
($ in millions)
Common Accumulated
Stock and Other
Additional Comprehensive Total IBM Non-
Paid-in Retained Treasury Income/ Stockholders’ controlling Total
Capital Earnings Stock (Loss) Equity Interests Equity
2008
Equity, January 1, 2008 $35,188 $60,640 $(63,945) $ (3,414) $ 28,470 $145 $ 28,615
Net income plus other comprehensive
income/(loss):
Net income 12,334 12,334 12,334
Other comprehensive
income/(loss), net of tax:
Net unrealized gains/(losses)
on cash flow hedge derivatives
(net of tax expense of $79) 301 301 301
Foreign currency translation adjustments
(net of tax benefit of $153*) (3,552) (3,552) (3,552)
Retirement-related benefit plans:
Prior service (credits)/costs (net of
tax benefit of $86) (136) (136) (136)
Net (losses)/gains
(net of tax benefit of $8,436) (15,245) (15,245) (15,245)
Curtailments and settlements
(net of tax expense of $9) 16 16 16
Amortization of prior service (credits)/
costs (net of tax benefit of $73) (132) (132) (132)
Amortization of net gains/(losses)
(net of tax expense of $358) 640 640 640
Net unrealized gains/(losses)
on marketable securities
(net of tax benefit of $207) (324) (324) (324)
Total other comprehensive
income/(loss) (18,431) (18,431)
Subtotal: Net income plus other
comprehensive income/(loss) $ (6,097) $ (6,097)
Cash dividends declared—common stock (2,585) (2,585) (2,585)
Common stock issued under
employee plans (39,374,439 shares) 3,919 3,919 3,919
Purchases (1,505,107 shares) and
sales (5,882,800 shares) of treasury
stock under employee plans — net (36) 391 355 355
Other treasury shares purchased,
not retired (89,890,347 shares) 54 (10,618) (10,563) (10,563)
Changes in other equity (33) (33) (33)
Changes in noncontrolling interests (26) (26)
Equity, December 31, 2008 $39,129 $70,353 $(74,171) $(21,845) $ 13,465 $119 $ 13,584
* Foreign currency translation adjustments are presented gross except for associated hedges which are presented net of tax.
The accompanying notes on pages 68 through 130 are an integral part of the financial statements.