IBM 2010 Annual Report Download - page 4
Download and view the complete annual report
Please find page 4 of the 2010 IBM annual report below. You can navigate through the pages in the report by either clicking on the pages listed below, or by using the keyword search tool below to find specific information within the annual report.-
 1
1 -
 2
2 -
 3
3 -
 4
4 -
 5
5 -
 6
6 -
 7
7 -
 8
8 -
 9
9 -
 10
10 -
 11
11 -
 12
12 -
 13
13 -
 14
14 -
 15
15 -
16
-
17
-
18
-
19
-
20
-
21
-
22
-
23
-
24
-
25
-
26
-
27
-
28
-
29
-
30
-
31
-
32
-
33
-
34
-
35
-
36
-
37
-
38
-
39
-
40
-
41
-
42
-
43
-
44
-
45
-
46
-
47
-
48
-
49
-
50
-
51
-
52
-
53
-
54
-
55
-
56
-
57
-
58
-
59
-
60
-
61
-
62
-
63
-
64
-
65
-
66
-
67
-
68
-
69
-
70
-
71
-
72
-
73
-
74
-
75
-
76
-
77
-
78
-
79
-
80
-
81
-
82
-
83
-
84
-
85
-
86
-
87
-
88
-
89
-
90
-
91
-
92
-
93
-
94
-
95
-
96
-
97
-
98
-
99
-
100
-
101
-
102
-
103
-
104
-
105
-
106
-
107
-
108
-
109
-
110
-
111
-
112
-
113
-
114
-
115
-
116
-
117
-
118
-
119
-
120
-
121
-
122
-
123
-
124
-
125
-
126
-
127
-
128
-
129
-
130
-
131
-
132
-
133
-
134
-
135
-
136
-
137
-
138
-
139
-
140
 |
 |

IBM today
IBM’s performance in 2010 is indicative both of our
high-value market position and of the discipline we
apply to our strategy and operations. Since 2002,
we have added $14 billion to IBM’s pre-tax profit base,
increased our pre-tax income 3.4 times, our earnings
per share 4.7 times and our free cash flow 2.8 times.
Cumulatively, we have generated about $96 billion of
free cash flow.
Our strong 2010 continued this record of superior
performance:
Revenue and income: Our revenue was $99.9 billion,
up 4 percent. In 2010 we grew pre-tax income by
9 percent, to $19.7 billion, our highest ever.
Margins: IBM’s gross profit margin rose for the
seventh consecutive year—to 46.1 percent, up
9.4 points since 2002. Our pre-tax income margin rose
to 19.7 percent. Both margins are at their highest
in more than a decade. We achieved this by driving
productivity and continuing to shift our business
mix to more profitable segments. Once again, more
than 90 percent of our segment profit in 2010 was
from software, services and financing.
Earnings per share: We have continued to achieve
strong EPS growth. Last year was another record,
with diluted earnings per share of $11.52, up
15 percent. This marked eight straight years of
double-digit EPS growth.
Cash flow: IBM has consistently generated strong
cash flow, a key indicator of real business performance.
In 2010 our free cash flow, excluding the year-to-
year change in Global Financing receivables, was
$16.3 billion, an increase of $1.2 billion from 2009.
IBM ended 2010 with $11.7 billion of cash and
marketable securities.
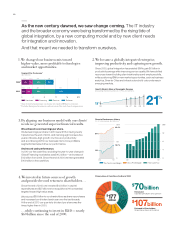
Investment and return to shareholders: Our superior
cash flow has enabled us to invest in the business and
to generate substantial returns to investors. Our 2010
cash investment was $6 billion for 17 acquisitions—
13 of them in key areas of software. After investing
$6 billion in R&D and $4 billion in net capital expendi-
tures, we were able to return more than $18 billion
to you—$15.4 billion through share repurchases and
$3.2 billion through dividends. Last year’s dividend
increase was 18 percent, marking the 15th year in a row
in which we have raised our dividend. Over the past
decade, we have returned $107 billion to you in the form
of dividends and share repurchases, while investing
$70 billion in capital expenditures and acquisitions,
and almost $60 billion in R&D.
Leading our industry
and the market
We have been able to achieve these results because
of the transformation of our company that we began
several years ago. At the time, we saw an undercurrent
of fundamental change.
2