IBM 2010 Annual Report Download - page 136
Download and view the complete annual report
Please find page 136 of the 2010 IBM annual report below. You can navigate through the pages in the report by either clicking on the pages listed below, or by using the keyword search tool below to find specific information within the annual report.-
 1
1 -
2
-
3
-
4
-
5
-
6
-
7
-
8
-
9
-
10
-
11
-
12
-
13
-
14
-
15
-
16
-
17
-
18
-
19
-
20
-
21
-
22
-
23
-
24
-
25
-
26
-
27
-
28
-
29
-
30
-
31
-
32
-
33
-
34
-
35
-
36
-
37
-
38
-
39
-
40
-
41
-
42
-
43
-
44
-
45
-
46
-
47
-
48
-
49
-
50
-
51
-
52
-
53
-
54
-
55
-
56
-
57
-
58
-
59
-
60
-
61
-
62
-
63
-
64
-
65
-
66
-
67
-
68
-
69
-
70
-
71
-
72
-
73
-
74
-
75
-
76
-
77
-
78
-
79
-
80
-
81
-
82
-
83
-
84
-
85
-
86
-
87
-
88
-
89
-
90
-
91
-
92
-
93
-
94
-
95
-
96
-
97
-
98
-
99
-
100
-
101
-
102
-
103
-
104
-
105
-
106
-
107
-
108
-
109
-
110
-
111
-
112
-
113
-
114
-
115
-
116
-
117
-
118
-
119
-
120
-
121
-
122
-
123
-
124
-
125
-
 126
126 -
 127
127 -
 128
128 -
 129
129 -
 130
130 -
 131
131 -
 132
132 -
 133
133 -
 134
134 -
 135
135 -
 136
136 -
 137
137 -
 138
138 -
 139
139 -
 140
140
 |
 |

134
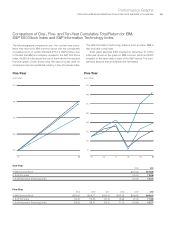
Performance Graphs
International Business Machines Corporation and Subsidiary Companies
Ten-Year
(U.S. Dollar)
Ten-Year
2000 2001 2002 2003 2004 2005 2006 2007 2008 2009 2010
• IBM Common Stock $100.00 $143.00 $92.28 $111.19 $119.19 $100.32 $120.15 $135.58 $107.43 $170.39 $194.72
• S & P 500 Index 100.00 88.12 68.64 88.33 97.94 102.75 118.99 125.52 79.08 100.01 115.07
• S & P Information
Technology Index 100.00 74.13 46.40 68.31 70.05 70.75 76.70 89.21 50.73 82.04 90.40
00 01 02 03 04 05 06 07 08 09 10
200
175
150
125
100
75
50
25