IBM 2010 Annual Report Download - page 48
Download and view the complete annual report
Please find page 48 of the 2010 IBM annual report below. You can navigate through the pages in the report by either clicking on the pages listed below, or by using the keyword search tool below to find specific information within the annual report.-
 1
1 -
2
-
3
-
4
-
5
-
6
-
7
-
8
-
9
-
10
-
11
-
12
-
13
-
14
-
15
-
16
-
17
-
18
-
19
-
20
-
21
-
22
-
23
-
24
-
25
-
26
-
27
-
28
-
29
-
30
-
31
-
32
-
33
-
34
-
35
-
36
-
37
-
 38
38 -
 39
39 -
 40
40 -
 41
41 -
 42
42 -
 43
43 -
 44
44 -
 45
45 -
 46
46 -
 47
47 -
 48
48 -
 49
49 -
 50
50 -
 51
51 -
 52
52 -
 53
53 -
 54
54 -
 55
55 -
 56
56 -
 57
57 -
 58
58 -
59
-
60
-
61
-
62
-
63
-
64
-
65
-
66
-
67
-
68
-
69
-
70
-
71
-
72
-
73
-
74
-
75
-
76
-
77
-
78
-
79
-
80
-
81
-
82
-
83
-
84
-
85
-
86
-
87
-
88
-
89
-
90
-
91
-
92
-
93
-
94
-
95
-
96
-
97
-
98
-
99
-
100
-
101
-
102
-
103
-
104
-
105
-
106
-
107
-
108
-
109
-
110
-
111
-
112
-
113
-
114
-
115
-
116
-
117
-
118
-
119
-
120
-
121
-
122
-
123
-
124
-
125
-
126
-
127
-
128
-
129
-
130
-
131
-
132
-
133
-
134
-
135
-
136
-
137
-
138
-
139
-
140
 |
 |
46
Management Discussion
International Business Machines Corporation and Subsidiary Companies
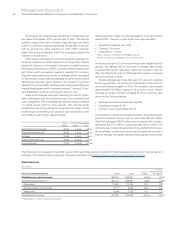
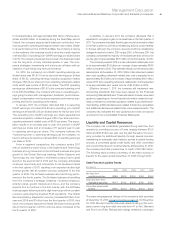
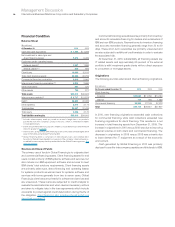
The company had $13,973 million in cash and marketable securities
at December 31, 2009.
Total liabilities decreased $9,672 million (decreased $11,213
million adjusted for currency) from December 31, 2008 driven by:
• Lower total debt ($7,826 million);
• Decrease in retirement-related benefit obligations ($3,500
million); partially offset by
• Higher tax liabilities ($1,083 million); and
• Increased deferred income ($997 million).
Total equity of $22,755 million increased $9,170 million from the
prior year-end balance as a result of:
• Higher retained earnings ($10,546 million);
• Increase in foreign currency translation adjustments ($1,732
million);
•
Increase in retirement-related items ($1,727 million) and common
stock ($2,682 million); partially offset by
• Increased treasury stock ($7,072 million); and
• Increased net unrealized losses on cash flow derivatives
($556 million).
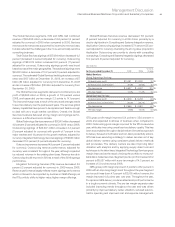
The company generated $20,773 million in cash flow provided by
operating activities, an increase of $1,961 million, compared to
2008, primarily driven by a decrease in receivables ($1,857 million).
Net cash used in investing activities of $6,729 million was $2,556
million lower than 2008, primarily due to the prior year Cognos
acquisition and the core logistics operations divestiture in 2009,
partially offset by the year-to-year impacts related to marketable
securities and other investments.
Net cash used in financing activities of $14,700 million was
$2,866 million higher, primarily due to debt repayments ($5,019
million), partially offset by lower common stock repurchases
($3,150 million) in 2009 versus 2008.
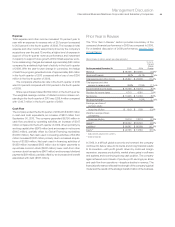
Other Information
Looking Forward
The company enters 2011 in an excellent position with a strong
portfolio of offerings, momentum in its key growth initiatives, a
solid operating model and a strong financial position. The company
will continue to transform the business by executing its strategy
to shift to higher-value areas, improving operating leverage and
investing where management sees the best long-term opportunities.
This transformation delivered solid performance in the past decade,
an overachievement of the 2010 earnings per share Road Map and
continues to position the company for growth going forward.
In May 2010, the company met with investors and introduced
a new Road Map for earnings per share in 2015, and also dis-
cussed its transition to operating earnings beginning in 2011.
In an effort to provide better transparency into the operational
results of the business, the company will separate business results
into operating and non-operating categories. Operating earnings
is a non-GAAP measure that excludes the effects of certain acqui-
sition-related charges and retirement-related costs, and their
related tax impacts. For acquisitions, operating earnings will
exclude the amortization of purchased intangible assets and
acquisition-related charges such as in-process research
and development, transaction costs, applicable restructuring
and related expenses and tax charges related to acquisition
integration. In the technology sector, it is common practice to
provide earnings information on a non-GAAP basis that excludes
acquisition-related items. Within retirement-related costs, given
the significant impact that the debt and equity markets can have
on the company’s retirement-related costs and the fact that these
market forces are not under direct management control and are
non-operational, the company has characterized certain items as
operating and others as non-operating. The company will include
defined benefit plan and nonpension postretirement benefit plan
service cost, amortization of prior service cost and the cost of
defined contribution plans in operating earnings. Non-operating
retirement-related cost will include defined benefit plan and non-
pension postretirement benefit plan interest cost, expected return
on plan assets, amortized actuarial gains/losses, the impacts of
any plan curtailments/settlements and multi-employer/pension
insolvency/other costs. These costs are primarily those related to
changes in pension plan assets and liabilities which are tied to
financial market performance and the company considers these
costs to be outside the operational performance of the business.
Overall, the company believes that providing investors with a
view of operating earnings will provide better transparency and
clarity into both the operational results of the business and the
impact of the performance of the company’s pension plans;
improve visibility to management decisions and their impacts on
operational performance; enable better comparison to peer com-
panies; and, allow the company to provide a long-term strategic
view of the business going forward. There will be no changes
to the balance sheet or cash flow presentation. The company
will provide this view of its performance in addition to its GAAP
reporting. The company’s calculation of operating earnings may
differ from similarly titled measures reported by other companies.
The objective of the company’s new Road Map for growth is
to achieve at least $20 of operating (non-GAAP) earnings per
diluted share in 2015. Consistent with the prior Road Map, the com-
pany has identified the major drivers of financial performance:
revenue growth, operating leverage and common stock share
repurchase. The revenue growth will come from a combination of
base revenue growth, a mix to faster growing businesses and from
acquisitions closed between 2010 and 2015. The contribution from
operating leverage will be driven by the shift to higher-margin busi-
nesses and enterprise productivity. The company is driving for $8
billion of productivity over the next five years—part which will result
in improved profitability and part which will drive competitiveness
in the marketplace. The company will also continue to return value