IBM 2010 Annual Report Download - page 46
Download and view the complete annual report
Please find page 46 of the 2010 IBM annual report below. You can navigate through the pages in the report by either clicking on the pages listed below, or by using the keyword search tool below to find specific information within the annual report.-
 1
1 -
2
-
3
-
4
-
5
-
6
-
7
-
8
-
9
-
10
-
11
-
12
-
13
-
14
-
15
-
16
-
17
-
18
-
19
-
20
-
21
-
22
-
23
-
24
-
25
-
26
-
27
-
28
-
29
-
30
-
31
-
32
-
33
-
34
-
35
-
 36
36 -
 37
37 -
 38
38 -
 39
39 -
 40
40 -
 41
41 -
 42
42 -
 43
43 -
 44
44 -
 45
45 -
 46
46 -
 47
47 -
 48
48 -
 49
49 -
 50
50 -
 51
51 -
 52
52 -
 53
53 -
 54
54 -
 55
55 -
 56
56 -
57
-
58
-
59
-
60
-
61
-
62
-
63
-
64
-
65
-
66
-
67
-
68
-
69
-
70
-
71
-
72
-
73
-
74
-
75
-
76
-
77
-
78
-
79
-
80
-
81
-
82
-
83
-
84
-
85
-
86
-
87
-
88
-
89
-
90
-
91
-
92
-
93
-
94
-
95
-
96
-
97
-
98
-
99
-
100
-
101
-
102
-
103
-
104
-
105
-
106
-
107
-
108
-
109
-
110
-
111
-
112
-
113
-
114
-
115
-
116
-
117
-
118
-
119
-
120
-
121
-
122
-
123
-
124
-
125
-
126
-
127
-
128
-
129
-
130
-
131
-
132
-
133
-
134
-
135
-
136
-
137
-
138
-
139
-
140
 |
 |

44
Management Discussion
International Business Machines Corporation and Subsidiary Companies
($ in millions)
Yr.-to-Yr.
For the year ended December 31: 2009 2008 Change
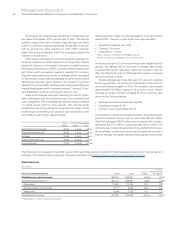
Systems and Technology:
External gross profit $6,127 $7,341 (16.5)%
External gross profit margin 37.8% 38.1% (0.2) pts.
Pre-tax income $1,419 $1,550 (8.5)%
Pre-tax margin 8.3% 7.7% 0.6 pts.
The decrease in external gross profit for 2009 versus 2008 was
primarily driven by lower revenue.
Overall, gross margin decreased 0.2 points versus the prior
year. Margin improvements in System x, Power Systems and
System z were offset by impacts due to product mix and a margin
decline in Microelectronics.
Systems and Technology’s pre-tax income decreased
8.5 percent in 2009 when compared to 2008 driven by lower
revenue. Pre-tax margin increased 0.6 points in 2009 versus the
prior year, reflecting the focus on cost and expense management
and improving productivity.
Global Financing
See pages 55 through 59 for an analysis of Global Financing’s
segment results.
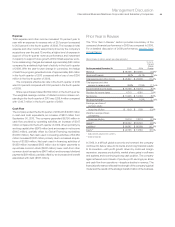
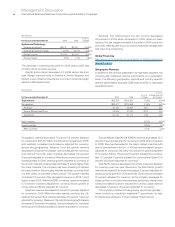
Geographic Revenue
In addition to the revenue presentation by reportable segment, the
company also measures revenue performance on a geographic
basis. The following geographic, regional and country-specific
revenue performance excludes OEM revenue, which is discussed
separately below.
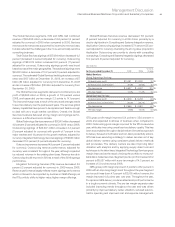
($ in millions)
Yr.-to-Yr.
Yr.-to-Yr. Change Adjusted
For the year ended December 31: 2009 2008 Change for Currency
Total revenue: $95,758 $103,630 (7.6)% (5.3)%
Geographies: $93,477 $100,939 (7.4)% (5.1)%
Americas 40,184 42,807 (6.1) (5.1)
Europe/Middle East/Africa 32,583 37,020 (12.0) (5.7)
Asia Pacific 20,710 21,111 (1.9) (3.7)
Major markets (8.2)% (6.4)%
Growth markets (3.5)% 1.2%
BRIC countries 0.7% 4.3%
Geographic revenue decreased 7.4 percent (5 percent adjusted
for currency) to $93,477 million in 2009 when compared to 2008,
with relatively consistent performance, adjusted for currency,
across the geographies. Revenue from the growth markets
decreased 3.5 percent (increased 1 percent adjusted for currency)
and revenue from the major markets decreased 8.2 percent
(6 percent adjusted for currency). While the economic environment
slowed globally in 2009, revenue growth, adjusted for currency, in
the growth markets remained approximately 8 points higher than
the major markets. The company has been investing to capture
the opportunity in the emerging markets as these countries build
out their public and private infrastructures. The growth markets
contributed 19 percent of the geographic revenue in 2009, 1 point
higher versus 2008. Within the BRIC countries, revenue increased
0.7 percent (4 percent adjusted for currency) led by growth in
China, India and Brazil, adjusted for currency.
Americas revenue decreased 6.1 percent (5 percent adjusted
for currency) in 2009. Within the major market countries, the U.S.
declined 6.5 percent and Canada decreased 7.1 percent (1 percent
adjusted for currency). Revenue in the Latin America growth markets
decreased 3.4 percent (increased 1 percent adjusted for currency)
led by growth in Brazil (increased 3 percent adjusted for currency).
Europe/Middle East/Africa (EMEA) revenue decreased 12.0
percent (6 percent adjusted for currency) in 2009 when compared
to 2008. Revenue decreased in the major market countries with
year-to-year declines in the U.K. of 13.6 percent (increased 1 percent
adjusted for currency), Germany 10.3 percent (6 percent adjusted
for currency), France 11.6 percent (7 percent adjusted for currency),
Italy 11.3 percent (7 percent adjusted for currency) and Spain 12.6
percent (8 percent adjusted for currency).
Asia Pacific revenue decreased 1.9 percent (4 percent adjus ted
for currency) year over year. Revenue in the Asia Pacific growth
markets decreased 2.4 percent (increased 3 percent adjusted for
currency), led by growth in China and India. China revenue increased
10 percent, adjusted for currency, as the company leveraged its
broad portfolio to provide comprehensive solutions to clients. India
revenue increased 6 percent, adjusted for currency. Japan revenue
decreased 1.4 percent (10 percent adjusted for currency).
The company continues to see growing opportunity globally—
much of which is outside the traditional IT opportunity—to help
its clients drive efficiency in their physical infrastructures.