IBM 2010 Annual Report Download - page 58
Download and view the complete annual report
Please find page 58 of the 2010 IBM annual report below. You can navigate through the pages in the report by either clicking on the pages listed below, or by using the keyword search tool below to find specific information within the annual report.-
 1
1 -
2
-
3
-
4
-
5
-
6
-
7
-
8
-
9
-
10
-
11
-
12
-
13
-
14
-
15
-
16
-
17
-
18
-
19
-
20
-
21
-
22
-
23
-
24
-
25
-
26
-
27
-
28
-
29
-
30
-
31
-
32
-
33
-
34
-
35
-
36
-
37
-
38
-
39
-
40
-
41
-
42
-
43
-
44
-
45
-
46
-
47
-
 48
48 -
 49
49 -
 50
50 -
 51
51 -
 52
52 -
 53
53 -
 54
54 -
 55
55 -
 56
56 -
 57
57 -
 58
58 -
 59
59 -
 60
60 -
 61
61 -
 62
62 -
 63
63 -
 64
64 -
 65
65 -
 66
66 -
 67
67 -
 68
68 -
69
-
70
-
71
-
72
-
73
-
74
-
75
-
76
-
77
-
78
-
79
-
80
-
81
-
82
-
83
-
84
-
85
-
86
-
87
-
88
-
89
-
90
-
91
-
92
-
93
-
94
-
95
-
96
-
97
-
98
-
99
-
100
-
101
-
102
-
103
-
104
-
105
-
106
-
107
-
108
-
109
-
110
-
111
-
112
-
113
-
114
-
115
-
116
-
117
-
118
-
119
-
120
-
121
-
122
-
123
-
124
-
125
-
126
-
127
-
128
-
129
-
130
-
131
-
132
-
133
-
134
-
135
-
136
-
137
-
138
-
139
-
140
 |
 |

56
Management Discussion
International Business Machines Corporation and Subsidiary Companies
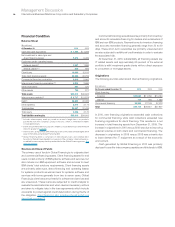
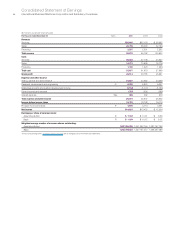
Financial Condition
Balance Sheet
($ in millions)
At December 31: 2010 2009
Cash and cash equivalents $ 1,353 $ 1,285
Net investment in sales-type and
direct financing leases 9,370 9,482
Equipment under operating leases:
External clients
(a) 1,827 1,863
Internal clients
(b)(c) 500 994
Client loans 10,630 10,413
Total client financing assets 22,326 22,752
Commercial financing receivables 6,819 5,662
Intercompany financing receivables
(b)(c) 4,204 3,660
Other receivables 321 370
Other assets 790 877
Total assets $35,813 $34,605
Intercompany payables
(b) $ 6,717 $ 5,879
Debt (d) 22,823 22,383
Other liabilities 3,016 3,174
Total liabilities 32,557 31,435
Total equity 3,256 3,170
Total liabilities and equity $35,813 $34,605
(a) Includes intercompany mark up, priced on an arm’s-length basis, on products
purchased from the company’s product divisions, which is eliminated in IBM’s
consolidated results.
(b) Entire amount eliminated for purposes of IBM’s consolidated results and therefore
does not appear on page 63.
(c) These assets, along with all other financing assets in this table, are leveraged at the
value in the table using Global Financing debt.
(d) Global Financing debt is comprised of intercompany loans and external debt.
A portion of Global Financing debt is in support of the company’s internal business,
or related to intercompany mark up embedded in the Global Financing assets. See
table on page 58.
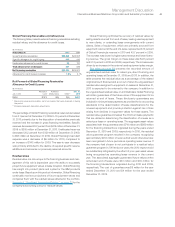
Sources and Uses of Funds
The primary use of funds in Global Financing is to originate client
and commercial financing assets. Client financing assets for end
users consist primarily of IBM systems, software and services, but
also include non-IBM equipment, software and services to meet
IBM clients’ total solutions requirements. Client financing assets
are primarily sales-type, direct financing and operating leases
for systems products as well as loans for systems, software and
services with terms generally from two to seven years. Global
Financing’s client loans are primarily for software and services and
are unsecured. These loans are subjected to credit analysis to
evaluate the associated risk and, when deemed necessary, actions
are taken to mitigate risks in the loan agreements which include
covenants to protect against credit deterioration during the life of
the obligation. Client financing also includes internal activity as
described on page 23.
Commercial financing receivables arise primarily from inventory
and accounts receivable financing for dealers and remarketers of
IBM and non-IBM products. Payment terms for inventory financing
and accounts receivable financing generally range from 30 to 90
days. These short-term receivables are primarily unsecured and
are also subjected to additional credit analysis in order to evaluate
the associated risk.
At December 31, 2010, substantially all financing assets are
IT related assets, and approximately 65 percent of the external
portfolio is with investment grade clients with no direct exposure
to consumers or mortgage assets.
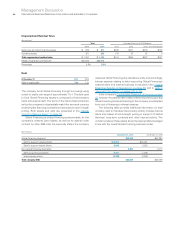
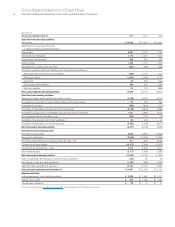
Originations
The following are total external and internal financing originations.
($ in millions)
For the year ended December 31: 2010 2009 2008
Client financing:
External $12,632 $11,760 $14,790
Internal 116 755 1,039
Commercial financing 32,366 27,126 32,078
Tot a l $45,113 $39,641 $47,907
In 2010, new financing originations exceeded cash collections
for commercial financing, while cash collections exceeded new
financing originations for client financing. This resulted in a net
increase in total financing assets from December 31, 2009. The
increase in originations in 2010 versus 2009 was due to improving
external volumes in both client and commercial financing. The
decrease in originations in 2009 versus 2008 was primarily due
to lower demand for IT equipment as a result of the economic
environment.
Cash generated by Global Financing in 2010 was primarily
deployed to pay the intercompany payables and dividends to IBM.